So let’s talk about the best metric no one thinks about.

A Good Question

I was working with a client troubleshooting an issue several years back now, and they asked a question that was difficult to answer.

We were troubleshooting a slow query, and the reason it was taking so long was oddly opaque.

  • It wasn’t blocked
  • It wasn’t waiting on CPU or driving the CPU on the server
  • It wasn’t waiting on memory
  • It wasn’t waiting on the disks

So, the usual suspects were out. We didn’t have the plan for this query yet, and were operating without much information yet. So, the client asked the simple question, “If it isn’t waiting on anything, why isn’t it done?”

I thought it a simple question at first, then I really thought about it. With the usual suspects out, we really couldn’t see what SQL Server was doing. What could be taking up that time?

Invisible culprit

It finally occurred to me that just because we weren’t seeing the disks spike didn’t mean we weren’t doing a lot of reads. Logical reads don’t involve the disks; we’re only reading pages that are already in memory. They are faster than physical reads for sure, but that doesn’t mean they are instant.

The logical reads themselves won’t cause waits. They will use some CPU cycles, but in this case we saw no CPU related wait type or a high overall CPU %.

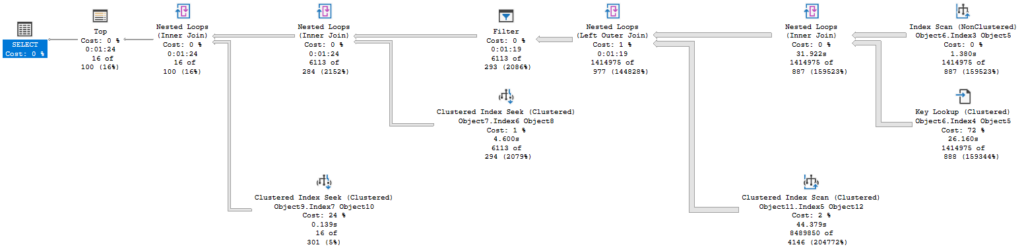
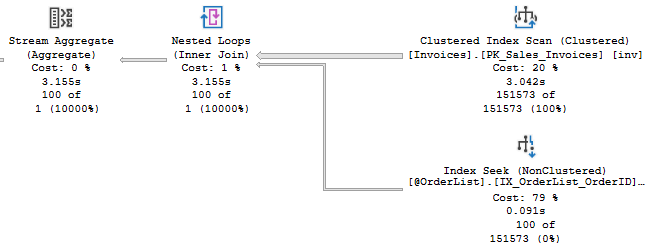
Take the plan above. It took 84 seconds to complete, and only returned 16 rows. But it read millions of rows at the lower levels. If the tables involved are largely in memory, we won’t be waiting on physical IO. It’s a SELECT statement, so it won’t be blocked or blocking if you are using read-committed snapshot isolation level (RCSI, I should blog about that).

With no waits or blocking, how would you see this query is less than optimal unless you are looking for it?

Detecting logical reads

We eventually got the execution plan and it confirmed my suspicion. The plan was reading many, many rows and joining across a number of tables. Once we had the plan, were able to come up with a plan to filter it down faster.

But the lesson here is the effects of logical reads are hard to detect. This makes logical reads a good metric to check for if you want to look at your activity within SQL Server. Here’s an example script for returning the queries with the highest logical reads in the execution cache, centering around sys.dm_exec_query_stats :

SELECT TOP 50 
	qs.creation_time, 
	qs.execution_count, 
	qs.total_logical_reads, 
	qs.total_logical_reads/qs.execution_count AS ave_logical_reads, 
	qs.total_elapsed_time, 
	qs.max_elapsed_time, 
	qs.total_elapsed_time/qs.execution_count as ave_duration, 
	substring(t.text, qs.statement_start_offset/2+1, 
		(CASE WHEN qs.statement_end_offset=-1 THEN (len(t.text)- qs.statement_start_offset)/2
		ELSE (qs.statement_end_offset- qs.statement_start_offset)/2 END )+1) AS statement_text,
	qp.query_plan,
	t.[text], 
	db_name(t.dbid) as db_name, 
	OBJECT_NAME( t.objectid, t.dbid) AS object_name, 
	qs.total_worker_time AS total_cpu_time, 
	qs.total_worker_time/qs.execution_count AS ave_cpu_time, 
	qs.total_physical_reads, 
	qs.total_physical_reads/qs.execution_count AS ave_physical_reads
	--,qs.plan_handle, qs.plan_generation_num
FROM sys.dm_exec_query_stats qs 
OUTER APPLY sys.dm_exec_sql_text(plan_handle) AS t
OUTER APPLY sys.dm_exec_query_plan(plan_handle) AS qp
ORDER BY qs.total_logical_reads DESC;
GO

This will let you look through the query stats for anything currently in the cache, but of course a restart of SQL Server or another action that clears the cache will mean there isn’t much to see.

If you use Query Store, you could see the queries with the most logical reads in the last two hours with the following:

SELECT TOP 10 
	SUM(rs.avg_logical_io_reads) AS sum_logical_io_reads,
	q.query_id,
	p.plan_id, 
	qt.query_sql_text, 
	p.query_plan,
	rsi.start_time
FROM sys.query_store_query_text AS qt
JOIN sys.query_store_query AS q
    ON qt.query_text_id = q.query_text_id
JOIN sys.query_store_plan AS p
    ON q.query_id = p.query_id
JOIN sys.query_store_runtime_stats AS rs
    ON p.plan_id = rs.plan_id
JOIN sys.query_store_runtime_stats_interval rsi
	ON rsi.runtime_stats_interval_id = 
		rs.runtime_stats_interval_id
WHERE 
	rsi.start_time > DATEADD(HOUR,-2,GETUTCDATE())
GROUP BY 
	q.query_id,
	p.plan_id, 
	qt.query_sql_text, 
	p.query_plan,
    rsi.start_time
ORDER BY SUM(rs.avg_logical_io_reads) DESC

Conclusion

Another point to consider, while physical reads take more time, the difference between the two is somewhat random. Whether given pages are in memory or not will affect how long a query takes, but we can’t really control what’s in memory without taking unusual measures.

Logical reads will always occur, and should be a more consistent measure of how much work a query requires.

Based on the plan, we may also end up reading to the same page in memory many times, for example if we have a cross product in our query.

I hope you find this post helpful.

If you have any topics related to performance in SQL Server you would like to hear more about, please feel free to @ me and make a suggestion.

Please follow me on twitter (@sqljared) or contact me if you have questions.

Happy Thanksgiving.

Hints in SQL Server

I used to be really suspicious of using hints in SQL Server, and now I can’t imagine working without them.

My opinion on this topic changed over the last few years due to a number of the performance issues I’ve worked on. I spoke at SQLSaturday 1000 (Oregon 2020) last weekend, and my talk was primarily about things I learned optimizing garbage collection and similar incremental processes. During that work I ran into a number of issues with queries like this example from the WideWorldImporters database:

	DELETE inv
	FROM @OrdersGC gc
	JOIN Sales.Invoices inv
		ON inv.OrderID = gc.OrderID;

Order Matters

The logic here is simple enough. Earlier in the process, we found orders we wanted to delete per retention policy, and put the OrderID values in a memory optimized table variable. We then use the motv to delete from all related tables, and finally the Orders table.

This query doesn’t have a WHERE clause. It’s plain to see how we want this to function though. We have 100 rows in our motv, and we want to delete the related rows in Invoices. But I’ve seen issues caused by execution plans that flip the order:

Table variables have no statistics, so the optimizer doesn’t know how many rows to expect from that operation (though table variable deferred compilation in SQL Server 2019 can resolve this) . Occasionally, I would see a plan with a join order that is the opposite of my expectation. The lack of a WHERE clause hurts here, but there’s no clause I can apply that will filter better than the items I already have in my table variable.

Consistency

I work on hundreds of databases with the same schema. They have different data sets and distributions, different sizes, and their statistics are going to update at different times. But if one of them chooses a bad plan, I have to push aside whatever other work to research the high CPU on database xyz.

Consistency is really valuable to me. And in this case, the answer is simple. Yes, I want to scan the fast, small memory-optimized table variable first, and use it to filter the larger, slower table. Adding a join hint or a force order to this query should keeps its plan and performance consistent.

	DELETE inv
	FROM @OrderList gc
	INNER LOOP JOIN Sales.Invoices inv
		ON inv.OrderID = gc.OrderID;

	DELETE inv
	FROM @OrderList gc
	JOIN Sales.Invoices inv
		ON inv.OrderID = gc.OrderID
	WITH OPTION(FORCE ORDER);

Both approaches force the join order. The INNER LOOP JOIN hint has the added benefit of ensuring the plan uses a nested loops join. A hash match wouldn’t be efficient with a batch size of a few hundred or a few thousand. A merge join would likely require a sort of one of the inputs, which defeats the purpose.

Index hints

I had to use index hints in an example I was using in my session for SQLSaturday 1000 (Oregon 2020).

DELETE TOP (@BatchSize) vt
FROM Warehouse.VehicleTemperatures vt
WHERE vt.RecordedWhen < DATEADD(DAY, -180, GETUTCDATE());

This was an example of a garbage collection process. The plan didn’t appear to be a problem, but we should be suspicious of the scan here:

The table scan only read 100 rows, but that’s because there is a TOP operator. The first 100 rows met our filter, so the query ended at that point. If no rows (or less than 100) matched, we would have scanned the entire table.

An index exists on the RecordedWhen column; it just wasn’t used. This is another place where a hint seems obvious. Maybe updating statistics would also resolve the issue, but this gives me more certainty.

DELETE TOP (@BatchSize) vt
FROM Warehouse.VehicleTemperatures vt WITH (INDEX(IX_VehicleTemperatures_RecordedWhen))
WHERE
	vt.RecordedWhen < DATEADD(DAY, -180, GETUTCDATE());

With Great Power

By using hints we are taking some of the responsibility away from the SQL Server, and we can cause entirely new problems. Here are some considerations before you try adding a hint.

  1. Relationships. Make sure you understand the cardinality and relationship between tables. This will inform your expectations about how many rows will be returned where.
  2. Indexes. Understand what options you have on each table in your query. A table may use one index based on the WHERE clause, or another based on the ON clause. The join order and indexes used are related. An index hint may push SQL Server to a specific join order; vice versa with join\order hints.
  3. Index hints can break your code! If you use an index hint in a procedure and later drop the index, SQL Server will not politely ignore your suggestion and move on. The procedure will fail until you remove the hint or recreate the index. So, if you use index hints, be aware of this and always check if any hints reference an index before you drop it.
  4. The most effective filter. If the logic of your statement filters across several tables, consider which one should reduce your result set the most. You probably want that table first in your execution plan.
  5. Test and test again. The new plans may be completely different from what we imagine, so we really must test our hinted queries and procedures with gusto. Test it for a variety of cases to make sure your code works on realistic data sets. In my case, I will sometimes test against large and small restored databases to make sure it performs as expected.

I’ve heard other engineers speak dismissively of hints, but I would encourage you to not discard a useful tool. Just realize you can cut yourself with it.

One of my coworkers recently resolved a performance issue by changing the join order and forcing it with a hint, or “doing a Jared Poche” in his words. Which shows you how often I’ve used hints, and how often they’ve worked.

Hopefully you learned something from this post. Please follow me on twitter (@sqljared) or contact me if you have questions.