Reducing waits is a great way to improve the performance of your SQL Servers. Minimizing PAGELATCH_EX and PAGELATCH_SH wait types are more involved than most. There are generally two causes; one of which is largely solved in recent versions, and one which requires real thought and planning to resolve.
Tempdb Contention
Tempdb contention is caused when there is a high rate of object creation in tempdb. There are specific pages (the GAM, SGAM, and PFS pages) that are locked exclusively when allocating space for the new objects. This creates a bottleneck by serializing part of the process.
This shows up as a PAGELATCH_xx wait type, but to differentiate this from the other major cause of page latch contention, check the wait description. If you see three numbers separated by colons and the first number is a 2, you’re seeing tempdb contention. Consider this wait description: 2:1:1.
- This three-part number indicates the db_id, file_id, and page_id this thread is waiting for access to.
- db_id 2 corresponds to tempdb.
- The file_id of 1 indicates the first data file for that database. If there are additional tempdb files any of them could be referenced. Adding data files reduces the contention by providing another set of key pages, so 1 is the most likely number you will see.
- Most often the page_id will be 1 or 3 (the PFS or SGAM pages). As a file grows, additional PFS, GAM, and SGAM pages will be created at regular intervals, so if you see much larger numbers, it’s still the same issue.
There were a few options to mitigate this in older versions, but there have been changes since SQL Server 2016 that made this easier or automatic. This has been essentially solved in SQL Server 2022.
For my full post on this topic including a list of the changes in each version, see https://www.sqljared.com/blog/tempdb-contention-in-2023/.
Page Latch and the Hot Page Issue
If you see page latch waits that are not tempdb related, you are likely experiencing the hot page issue. This happens when many different connections are attempting to update the same page in memory.
This can happen with any write operation, but it’s probably easiest to understand when inserting new rows into a table. Imagine inserting new records one at a time into a table with a clustered index based on an IDENTITY(1,1) column.
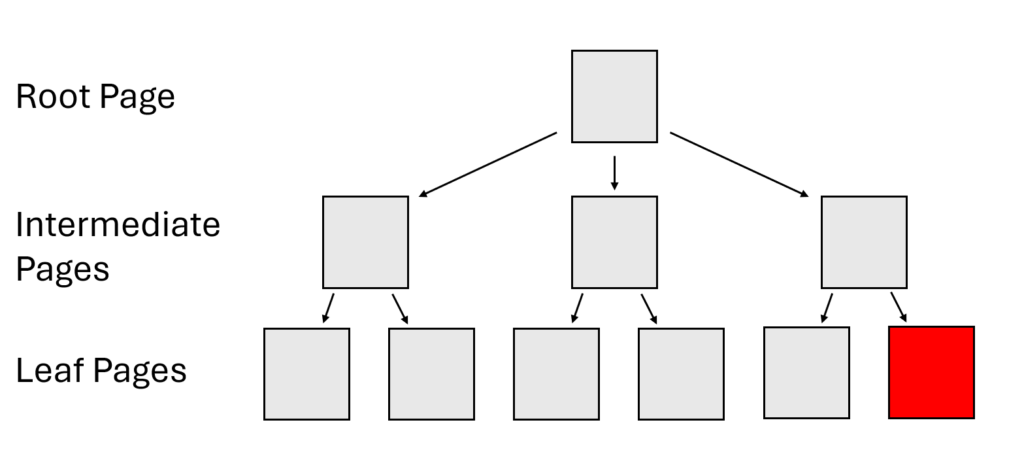
The IDENTITY value for the next row will be the highest in the table, and the row will be placed in the last page. But that will be the case for each new row. If many different threads are trying to insert into the table simultaneously, they will block each other since they need exclusive access to the last page.
Even though the page is in memory and access is faster, it is not instantaneous.
Most documentation on the subject will focus on the clustered index, and I will also focus on it here. You can see page latch waits when there is a nonclustered index on an IDENTITY (or other sequential) column, but it will typically require an order of magnitude more inserts before you will see the contention on a nonclustered (and typically smaller) index.
So, how do we address this? There are several possibilities.
Change the clustered index
The issue here is the clustered index is based on our IDENTITY column. If you made this a nonclustered index instead, you could create a clustered index on another column. The order of the table would be based on the column(s) of the new clustered index.
This could be a composite index, which could still include the IDENTITY column. However the first column will determine the order of the rows in the table, and the goal would be for us to insert new rows randomly throughout the table.
I would prefer to use a small column for this as the clustered indexes columns get added to all other indexes in the table, duplicating that data. I also would choose a column that has many different values. If you chose a BIT field, you would go from having one hot page to having two. That may not improve matters.
You should also be careful not to use another column that would be, in practice, sequential. For example, a column that has the DATETIME for when the row was created would not be an IDENTITY column, but its values would be sequential and you would always insert it into the final page of the index.
I should also mention that randomizing the location of our inserts also means increasing our fragmentation. We will be getting page splits where we are inserting. That doesn’t happen if we insert it to the end of the index, we create a new empty page. This isn’t a huge concern for me, but it is a valid point.
You could also not have a clustered index at all, and the table will be stored in a heap with no order.
Use a computed column
If you don’t see a column you want to use for your clustered index, you can always create a new one.
ALTER TABLE Sales.OrderLines
ADD HashValue AS (CONVERT(tinyint, (OrderLineID%10))) PERSISTED NOT NULL;
This creates a new column that uses the last digit from the OrderLineID in the same table, so a number from 0-9. If you make this the first column of your clustered index, each new row will be inserted based on the HashValue.
Effectively, we would have 10 pages where we insert instead of one. So there will be less contention on each of those pages. You could change the mod to be higher to spread out the inserts more, but that would also lead to more fragmentation.
Partition the table
If you partitioned the table, you effectively have multiple b-tree structures for the clustered index. If there are 10 partitions, each of them has a hot page. This is another way of going from one hot page where all new rows are inserted to using multiple pages.
Partitioning wouldn’t be my first approach. Unless I want the table to be partitioned for other purposes, like switching or truncating partitions, I wouldn’t want to introduce the complications of partitioning.
If your queries are not aligned (containing and filtering on the partitioning key), your queries will suddenly be reading all of the b-tree structures for the aligned index. This could be a substantial increase in reads and can increase duration.
OPTIMIZE_FOR_SEQUENTIAL_KEY
This is an option you can use when creating or rebuilding your indexes. This attempts to increase throughput by limiting the number of threads that can request the latch and favoring threads that are likely to complete their work in a single quantum.
With this enabled, you will see a new wait type, BTREE_INSERT_FLOW_CONTROL. You may see an increase in overall waits and some threads may see more latency if they are delayed for favored threads, but the result should be an increase in throughput.
For more details, see this blog from Pam Lahoud.
Reduce transaction size Tune your writes
My initial thought was to encourage you to look at the entire transaction containing the write that is running into page latch contention. The idea would be to shrink the transaction as a whole to allow its latches to be released sooner, but a little research showed a problem.
Latches are not held for the entire transaction, only for the operation that requires them. So if you are inserting a new row as part of a larger transaction, you will hold locks related to that INSERT for the entire transaction while latches are released when the INSERT is complete. For reference, please see the comparison of latches and locks in this Microsoft article.
Still, anything we can do to speed up that statement will release the latch sooner and allow greater throughput. If your operation reads a lot of data, optimize your execution plan as best you can. Add hints if that will make performance more consistent. Perhaps you can read the data in a separate statement to get the IDs of the rows to write so that your write operation can be simplified (using Manual Halloween).
Read Committed Snapshot
SELECT statements also require latches while accessing data, and they can add to the contention when running an INSERT or UPDATE on a hot page. If you see your writes operations wait on PAGELATCH_SH, you may want to consider using READ_COMMITTED_SNAPSHOT.
This is a database-level setting, so you will need to consider its impact on all operations in the database. But the benefit is that your read and write processes no longer block each other. If you are experiencing hot page contention, your reads will at least stop contributing to the problem.
Batch your operations
I’ve saved this for last because it’s probably the most effective solution and one requiring the most work. Instead of having 50 connections each calling the same procedure to insert one row each, why not make one call using a TVP input to insert all 50 rows?
If you work in a batch, you reduce the number of threads operating on a given table while processing the same number of rows. Reducing threads reduces contention.
The difficulty is the change to your application. Does it receive a large amount of data to insert all at once? If so, changing to a new procedure would be relatively simple. Do encourage your app developers to keep the batch size reasonable, given the size of one row in your TVP.
If the application only receives individual values to insert, you could queue them to insert a batch at once. This may be more complicated on the code side.
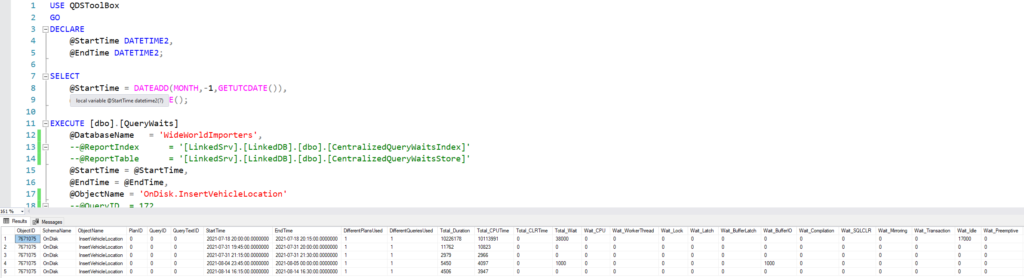
I have an example from a recent presentation where I inserted 500 rows of data into a table in the WideWorldImporters database in three different ways. The results are below.

The first method used a simple procedure to insert 1 row into the table. I ran this from SSMS 500 times. Of course, this meant I was inserting the values serially, and there was no contention from multiple threads running at once. This took 23 microseconds per row.
The second method used the same single-insert procedure, but SQLQueryStress allowed me to run 50 executions across 10 threads. I included sys.query_store_wait_stats in my query against Query Store so we can see “Buffer Latch” waits. Each row took 119 microseconds on average, and interestingly our CPU time for each insert was significantly higher (about 3x).
The third method used a different stored procedure taking a memory-optimized TVP as input and inserting all 500 rows in one call. The batched approach took 4.2 microseconds per row.
Conclusion
It’s been a while since my last post. I was focusing my attention on my presentation for the PASS Data Community Summit in November, which went very well and was a great experience.
And then I changed jobs at the start of December. This has been a good move for me, but it involved a lot of thought and emotion as it meant leaving a team with great people.
Things have settled now, and hopefully, I’ll get back to writing on a more regular cadence.
My social media links are above. Please contact me if you have questions, and I’m happy to consult with you if you have a more complex performance issue. Also, let me know if you have any suggestions for a topic for a new blog post.