I’ve learned a few more items of interest relating to Parameter Sensitive Plan Optimization that I wanted to pass on.

Parameter Sensitive Plan Optimization: Known issue resolved

First, I wanted to point out that there are fixes to issues specific to Parameter Sensitive Plan Optimization in SQL Server 2022. The issue itself is documented at the link below.

https://learn.microsoft.com/en-us/sql/relational-databases/performance/parameter-sensitive-plan-optimization?view=sql-server-ver16#known-issues

When I heard about the issue, I heard that it could cause SQL Server 2022 to cause stack dumps every 15 minutes. The time interval made me think it was related to the default interval for Query Store, and that seems to be the case.

There’s only one known issue documented, but there appear to be updates in CU5 and CU6 for this issue (or some variation of this issue). I’ll link to both below:

https://learn.microsoft.com/en-us/troubleshoot/sql/releases/sqlserver-2022/cumulativeupdate5#2357623

https://learn.microsoft.com/en-us/troubleshoot/sql/releases/sqlserver-2022/cumulativeupdate6#2470755

If you are using PSPO but not encountering this issue, that’s great. But I’d still update as soon as I can.

Don’t be a statistic

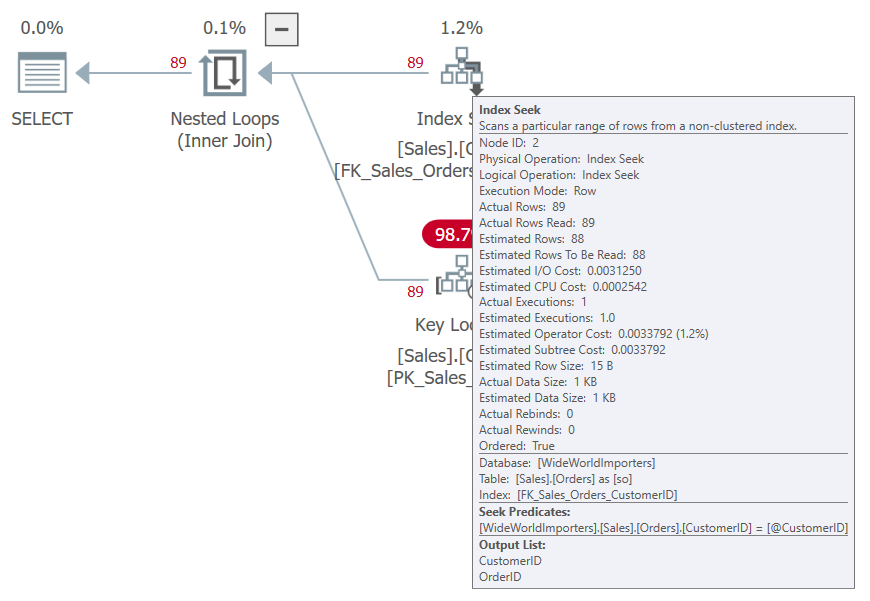
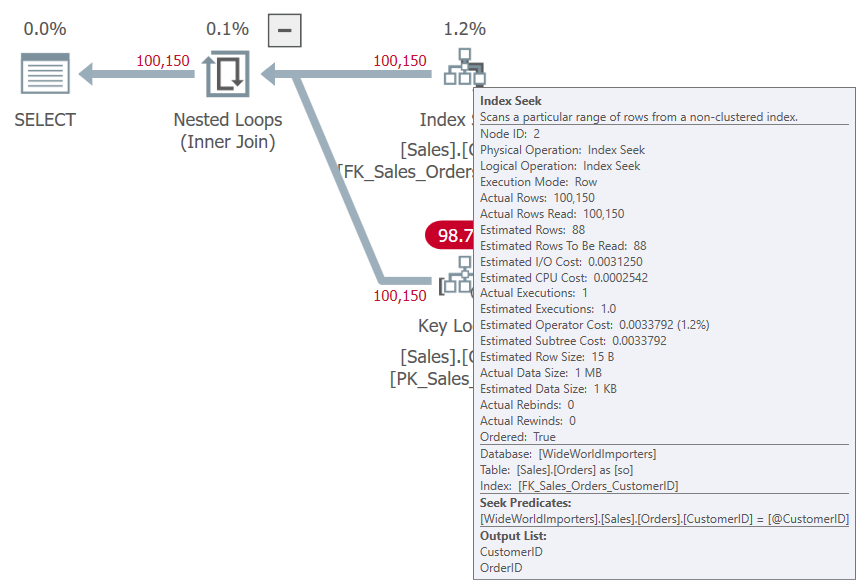
I was looking back at a previous blog post and trying to decide why I had not seen PSPO used when I tried testing using the WideWorldImporters database. I had deliberately skewed the data on the Sales.Orders table, and I tried running a procedure with different parameter values that should return a range of row counts.

Nothing.

But the point of PSPO is to take the variable passed in, determine how many rows we should expect it to return, then choose the correct plan based on that cardinality. So, its function depends on checking the histogram for that parameter.

And I hadn’t updated my statistics after I skewed the data…

It worked much better after I updated the stats.

Just thought I would drop that off to save someone else some time.

Odd relationship

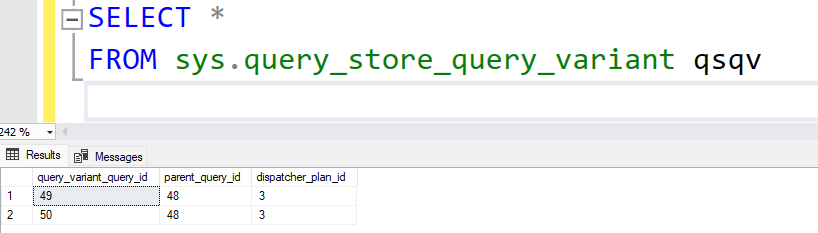
With that resolved, I ran a query to see my plans for this procedure. It has only one statement, but I wanted to see the base query, any variants, and their plans. Here’s the query:

SELECT 
	qsq.query_id,
	qsp.plan_id,
	qsq.query_text_id,
	qsp.plan_type,
	qsp.plan_type_desc,
	OBJECT_NAME(qsq.object_id),
	qv.query_id,
	qvp.plan_id,
	CAST(qvp.query_plan AS XML),
	qv.query_text_id,
	qvp.plan_type,
	qvp.plan_type_desc
FROM sys.query_store_query qsq
INNER JOIN sys.query_store_plan qsp
	ON qsp.query_id = qsq.query_id
LEFT JOIN sys.query_store_query_variant vr
	ON vr.parent_query_id = qsq.query_id
LEFT JOIN sys.query_store_query qv
	ON qv.query_id = vr.query_variant_query_id
LEFT JOIN sys.query_store_plan qvp
	ON qvp.query_id = qv.query_id
WHERE
	qsq.object_id = OBJECT_ID('Sales.GetOrders')
ORDER BY
	qsq.query_id,
	qsp.plan_id,
	qv.query_id,
	qvp.plan_id;

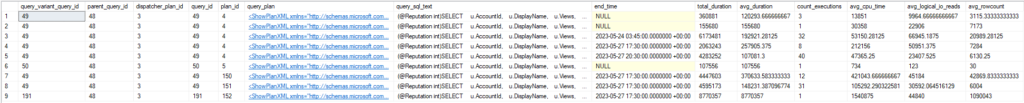
Here are the results and they were a little surprising.

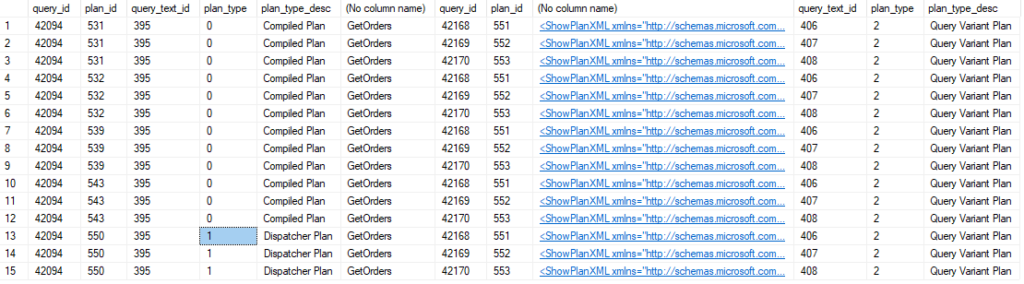
The parent query is the first column, with the dispatcher plan next.

It’s probably not immediately obvious what is odd here. The plan_type and plan_type_desc are included in the result set in columns 4 and 5 for the parent query. The first 12 rows show “Compiled Plan” as its type, but that’s the type for a “normal” query that isn’t using PSPO. So why are all the variant columns populated?

Because the query_id didn’t change once we started using a new dispatcher plan. Since we only joined to sys.query_store_query_variant based on the parent_query_id, we related our variant queries to all plans for the parent_query_id.

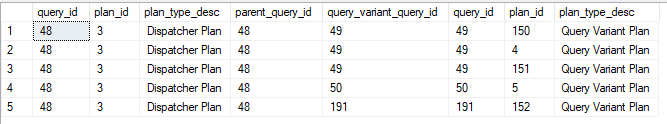
Joining on the dispatcher_plan_id as well seems appropriate.

LEFT JOIN sys.query_store_query_variant vr
	ON vr.parent_query_id = qsq.query_id
	AND vr.dispatcher_plan_id = qsp.plan_id

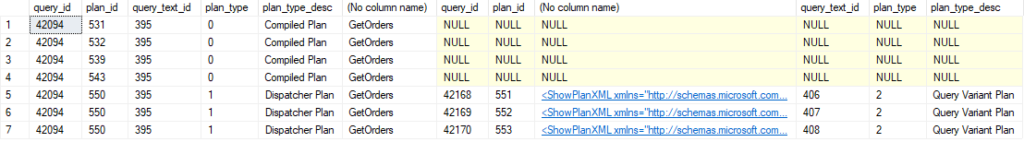
Yeah, that’s a lot better.

Multiple variables?

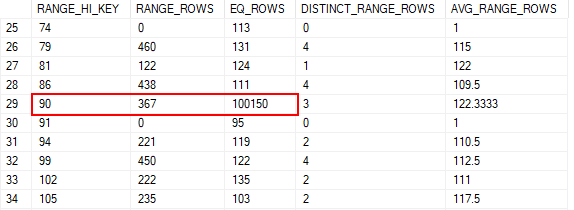
A skewed parameter will return a low (less than 100 rows), middle, or high (either more than 100,000 rows or more than 1 million) number of rows. When the optimizer sees the value of the parameter passed in, it gets the cardinality of that value to decide which plan to use.

But SQL Server can vary depending on up to three different parameters for a query. Each parameter has its low, middle, and high thresholds, and plans are created for the various combinations of those parameters.

I recently saw an example of a query using PSPO with multiple parameters. Here’s the dispatcher block of the XML from the anonymized plan for that query:

          <Dispatcher>
            <ParameterSensitivePredicate LowBoundary="100" HighBoundary="100000">
              <StatisticsInfo LastUpdate="2023-02-09T03:47:24.27" ModificationCount="26303" SamplingPercent="86.3454" Statistics="[_statistic_1]" Table="Object1" Schema="Schema1" Database="Database1" />
              <Predicate>
                <ScalarOperator ScalarString="ScalarString1">
                  <Compare CompareOp="EQ">
                    <ScalarOperator>
                      <Identifier>
                        <ColumnReference Database="Database1" Schema="Schema1" Table="Object1" Alias="Object3" Column="Column1" />
                      </Identifier>
                    </ScalarOperator>
                    <ScalarOperator>
                      <Identifier>
                        <ColumnReference Column="Column2" />
                      </Identifier>
                    </ScalarOperator>
                  </Compare>
                </ScalarOperator>
              </Predicate>
            </ParameterSensitivePredicate>
            <ParameterSensitivePredicate LowBoundary="100" HighBoundary="100000">
              <StatisticsInfo LastUpdate="2023-02-09T03:47:24.27" ModificationCount="7831" SamplingPercent="100" Statistics="[index_nonclustered_1]" Table="Object2" Schema="Schema1" Database="Database1" />
              <Predicate>
                <ScalarOperator ScalarString="ScalarString2">
                  <Compare CompareOp="EQ">
                    <ScalarOperator>
                      <Identifier>
                        <ColumnReference Database="Database1" Schema="Schema1" Table="Object2" Alias="Object4" Column="Column3" />
                      </Identifier>
                    </ScalarOperator>
                    <ScalarOperator>
                      <Identifier>
                        <ColumnReference Column="Column4" />
                      </Identifier>
                    </ScalarOperator>
                  </Compare>
                </ScalarOperator>
              </Predicate>
            </ParameterSensitivePredicate>
          </Dispatcher>

The Dispatcher block has the details for this plan that relate to PSPO.

  • The ParameterSensitivePredicate block shows the boundary values for the parameter, and there are two blocks in this plan. Both plans have boundary values of 100 and 100,000.
  • The StatisticsInfo block is very useful; it shows the statistic being used to make estimates and its sampling rate. The object and database are also indicated
  • The columns that relate to the parameters we are using for PSPO are in the ColumnReference block.

In my case, I saw two plans for the query in question, and if there were any differences they were trivial. Here’s one of the last blocks in the XML plan:

            </RelOp>
            <ParameterList>
              <ColumnReference Column="Column4" ParameterDataType="int" ParameterCompiledValue="Value1" />
              <ColumnReference Column="Column8" ParameterDataType="int" ParameterCompiledValue="Value2" />
              <ColumnReference Column="Column6" ParameterDataType="bit" ParameterCompiledValue="Value3" />
              <ColumnReference Column="Column12" ParameterDataType="int" ParameterCompiledValue="Value4" />
              <ColumnReference Column="Column2" ParameterDataType="int" ParameterCompiledValue="Value5" />
              <ColumnReference Column="Column10" ParameterDataType="bigint" ParameterCompiledValue="Value6" />
            </ParameterList>
          </QueryPlan>

Column2 and Column4 are the two related to our PSPO parameters. But there are several other columns that are important to our plan. The ParameterCompiledValue shows the actual value provided for each column when the plan was created. We see “Value1” because this is an anonymized plan.

Using these values, I was able to see how many records we should expect for each using the histogram from our statistics. While the cardinality of Column2 and Column4 may vary a lot depending on the inputs, other columns would not vary as much. Two, in particular, indicated that we would return 1 or a handful of rows at most.

So while the optimizer does the extra work of generating extra plans based on the parameters that have significant skew, the plan is really being driven by other parameters with much lower cardinality.

IN SUMMARY

I’ll post more on this subject as I come across anything new. I will also be presenting a session on Parameter Sensitive Plan Optimization at PASS Data Community Summit in Seattle this November. I hope you’ll consider attending. Last year was my first as a presenter, and I had a wonderful time.


You can follow me on Twitter (@sqljared) and contact me if you have questions. My other social media links are at the top of the page. Also, let me know if you have any suggestions for a topic for a new blog post.

I wrote about Parameter Sensitive Plan Optimization in my last blog. In this post, I want to talk about a specific problem you may see in Query Store, depending on how to get information from it.

A Query Store Example

I use Query Store frequently, and I tend to be working on a specific stored procedure at a time. Either I’m evaluating a procedure to see how we can improve its performance, or I’m testing\validating the improvements to that procedure. Here’s an example Query Store script I might use.

SELECT 
	qsq.query_id,
	qsp.plan_id,
	CAST(qsp.query_plan as XML) AS query_plan,
	qt.query_sql_text,
	rsi.end_time,
	(rs.avg_duration * rs.count_executions) as total_duration,
	rs.avg_duration,
	rs.count_executions,
	rs.avg_cpu_time,
	rs.avg_logical_io_reads,
	rs.avg_rowcount
FROM sys.query_store_query qsq
INNER JOIN sys.query_store_plan qsp
	ON qsp.query_id = qsq.query_id
INNER JOIN sys.query_store_query_text qt
	ON qt.query_text_id = qsq.query_text_id
INNER JOIN sys.query_store_runtime_stats rs
	ON rs.plan_id = qsp.plan_id
INNER JOIN sys.query_store_runtime_stats_interval rsi
	ON rsi.runtime_stats_interval_id = rs.runtime_stats_interval_id
WHERE
	qsq.object_id = OBJECT_ID('dbo.User_GetByReputation')
	AND rsi.end_time > DATEADD(DAY,-2, GETUTCDATE())

This query gets the execution stats from the procedure I used in my last blog post against the StackOverflow2013 database. Any executions in the last two days will be included in the results.

Or it should. When I run this I get “(0 rows affected)”.

But I just ran this procedure, so what’s the issue?

sys.query_store_query_variant

This is an example of a query that needs to be updated for SQL Server 2022 with Parameter Sensitive Plan Optimization in place, and the reason has to do with changes made to allow variant queries.

There is a new table in Query Store that is essential to the PSPO feature: sys.query_store_query_variant.

The table is something of a stub, with only three columns. This establishes the relationship between the parent query, variant queries, and the dispatcher plan.

You can see in this case there are two variants for the same parent_query_id. So, for a given query you could LEFT JOIN to sys.query_store_query_variant to find any variant queries it may have, then join back to sys.query_store_query to get the rest of the details for that variant query.

Parent Queries Don’t Execute

But why did my query have no results?

The first issue is that the parent queries and the plan associated with them don’t execute. Joining the tables that give the query, plan, and text is fine, but when we INNER JOIN sys.query_store_runtime_stats and sys.query_store_runtime_stats_interval we lose our results.

Running the same query with LEFT JOINs shows the execution stats are all NULL.

While we are here, if I click on the link for the plan I will see the dispatcher plan. This isn’t a full execution plan, but there is some information about the use of PSPO (the boundaries and details of the statistic used) in the XML.

<ShowPlanXML xmlns="http://schemas.microsoft.com/sqlserver/2004/07/showplan" Version="1.564" Build="16.0.1050.5">
  <BatchSequence>
    <Batch>
      <Statements>
        <StmtSimple StatementText="SELECT &#xD;&#xA;		u.AccountId,&#xD;&#xA;		u.DisplayName,&#xD;&#xA;		u.Views,&#xD;&#xA;		u.CreationDate&#xD;&#xA;	FROM dbo.Users u&#xD;&#xA;	WHERE &#xD;&#xA;		u.Reputation=@Reputation" StatementId="1" StatementCompId="3" StatementType="MULTIPLE PLAN" RetrievedFromCache="false" QueryHash="0x08FD84B17223204C" QueryPlanHash="0x86241E8431E63362">
          <Dispatcher>
            <ParameterSensitivePredicate LowBoundary="100" HighBoundary="1e+06">
              <StatisticsInfo LastUpdate="2023-05-19T14:04:14.91" ModificationCount="0" SamplingPercent="100" Statistics="[IX_User_Reputation]" Table="[Users]" Schema="[dbo]" Database="[StackOverflow2013]" />
              <Predicate>
                <ScalarOperator ScalarString="[StackOverflow2013].[dbo].[Users].[Reputation] as [u].[Reputation]=[@Reputation]">
                  <Compare CompareOp="EQ">
                    <ScalarOperator>
                      <Identifier>
                        <ColumnReference Database="[StackOverflow2013]" Schema="[dbo]" Table="[Users]" Alias="[u]" Column="Reputation" />
                      </Identifier>
                    </ScalarOperator>
                    <ScalarOperator>
                      <Identifier>
                        <ColumnReference Column="@Reputation" />
                      </Identifier>
                    </ScalarOperator>
                  </Compare>
                </ScalarOperator>
              </Predicate>
            </ParameterSensitivePredicate>
          </Dispatcher>
        </StmtSimple>
      </Statements>
    </Batch>
  </BatchSequence>
</ShowPlanXML>

But if we didn’t execute the dispatcher plan for the parent query, we should have executed the plan for the variant query. Why didn’t we see that in our results?

Variant Queries’ Object_ID = 0 (Adhoc)

The second issue is that variant queries have an object_id of 0 in sys.query_store_query; the same as an ad-hoc query.

I was filtering on the object_id of my procedure to only get results for that procedure, but that doesn’t include our variant queries.

But I can query from the sys.query_store_query_variant table to sys.query_store_query based on the query_variant_query_id to get the details for my variant query, then join to other tables to get the stats I was looking for.

SELECT 
	var.*,
	qsq.query_id,
	qsp.plan_id,
	CAST(qsp.query_plan as XML) AS query_plan,
	qt.query_sql_text,
	rsi.end_time,
	(rs.avg_duration * rs.count_executions) AS total_duration,
	rs.avg_duration,
	rs.count_executions,
	rs.avg_cpu_time,
	rs.avg_logical_io_reads,
	rs.avg_rowcount
FROM sys.query_store_query_variant var
INNER JOIN sys.query_store_query qsq
	ON qsq.query_id = var.query_variant_query_id
INNER JOIN sys.query_store_plan qsp
	ON qsp.query_id = qsq.query_id
LEFT JOIN sys.query_store_query_text qt
	ON qt.query_text_id = qsq.query_text_id
LEFT JOIN sys.query_store_runtime_stats rs
	ON rs.plan_id = qsp.plan_id
LEFT JOIN sys.query_store_runtime_stats_interval rsi
	ON rsi.runtime_stats_interval_id = rs.runtime_stats_interval_id
	AND rsi.end_time > DATEADD(DAY,-2, GETUTCDATE());

Getting the runtime statistics isn’t the hard part, it’s just identifying which queries we care about.

Silent Failure

If you use Query Store regularly, and especially if you have any tools or automation built on that information, you’ll need to account for the two points above. Because your existing scripts won’t fail, they will give you incomplete results. This is a case where an actual error would be more helpful; you’d know something had broken.

So, how do we get all the execution details for our procedure? First, let’s see the parent query and its children (updated per the addendum).

SELECT 
	qsq.query_id,
	qsp.plan_id,
	qsp.plan_type_desc,
	vr.parent_query_id,
	vr.query_variant_query_id,
	qv.query_id,
	qvp.plan_id,
	qvp.plan_type_desc
FROM sys.query_store_query qsq
INNER JOIN sys.query_store_plan qsp
	ON qsp.query_id = qsq.query_id
LEFT JOIN sys.query_store_query_variant vr
	ON vr.parent_query_id = qsq.query_id
    AND vr.dispatcher_plan_id = qsp.plan_id
LEFT JOIN sys.query_store_query qv
	ON qv.query_id = vr.query_variant_query_id
LEFT JOIN sys.query_store_plan qvp
	ON qvp.query_id = qv.query_id
WHERE
	qsq.object_id = OBJECT_ID('dbo.User_GetByReputation');

Also, note that sys.query_store_plan has two new columns that are relevant to us; plan_type_desc and plan_type. Query_id 48 is the parent query related to the “Dispatcher Plan”; the variant plan is marked as “Query Variant Plan”. A normal plan would be a “Compiled Plan”.

A Suggested Solution

We could return both, but we don’t really need to. The parent query has no related performance statistics, but we need the parent query to find all the variant queries that allow us to get the execution statistics.

There is one more issue to consider; sys.query_store_query_variant does not exist in a SQL Server instance below 2022. So if we want a procedure that can run on our un-upgraded instances, we’ll need two paths.

Oh, we also want to make sure we don’t miss plans for any queries not using PSPO.

Here’s a simple procedure that does that (which has been updated per the addendum).

USE StackOverflow2013 
GO
CREATE OR ALTER PROCEDURE dbo.QS_GetProcedurePerfDetails
  @Schema_Object NVARCHAR(100),
  @StartDate DATETIME2
AS
	DECLARE 
		@c_level INT,
		@obj_id INT;

	CREATE TABLE #QueryList (
		query_id INT,
		plan_id INT,
		query_plan NVARCHAR(MAX),
		query_text_id INT,
		plan_type_desc NVARCHAR(120) NULL
	);

	SELECT 
		@c_level = db.compatibility_level  
	FROM sys.databases db
	WHERE 
		db.database_id = DB_ID();

	SET @obj_id = OBJECT_ID(@Schema_Object);

	-- Based on the compatability level, get IDs for relevant queries and plans
	IF (@c_level < 160)
	BEGIN 
		INSERT #QueryList
		SELECT 
			qsq.query_id,
			qsp.plan_id,
			qsp.query_plan,
			qsq.query_text_id,
			NULL AS plan_type_desc
		FROM sys.query_store_query qsq
		INNER JOIN sys.query_store_plan qsp
			ON qsp.query_id = qsq.query_id
		WHERE
			qsq.object_id = @obj_id;
	END
	ELSE
	BEGIN
		INSERT #QueryList
		SELECT 
			ISNULL(qv.query_id,qsq.query_id) AS query_id,
			ISNULL(qvp.plan_id,qsp.plan_id) AS plan_id,
			ISNULL(qvp.query_plan,qsp.query_plan) AS query_plan,
			ISNULL(qv.query_text_id,qsq.query_text_id) AS query_text_id,
			ISNULL(qvp.plan_type_desc,qsp.plan_type_desc) AS plan_type_desc
		FROM sys.query_store_query qsq
		INNER JOIN sys.query_store_plan qsp
			ON qsp.query_id = qsq.query_id
		LEFT JOIN sys.query_store_query_variant vr
			ON vr.parent_query_id = qsq.query_id
            AND vr.dispatcher_plan_id = qsp.plan_id
		LEFT JOIN sys.query_store_query qv
			ON qv.query_id = vr.query_variant_query_id
		LEFT JOIN sys.query_store_plan qvp
			ON qvp.query_id = qv.query_id
		WHERE
			qsq.object_id = @obj_id;
	END;

	SELECT 
		ql.query_id,
		ql.plan_id,
		ql.plan_type_desc,
		CAST(ql.query_plan as XML),
		qt.query_sql_text,
		rsi.end_time,
		(rs.avg_duration * rs.count_executions) as total_duration,
		rs.avg_duration,
		rs.count_executions,
		rs.avg_cpu_time,
		rs.avg_logical_io_reads,
		rs.avg_rowcount
	FROM #QueryList ql
	INNER JOIN sys.query_store_query_text qt
		ON qt.query_text_id = ql.query_text_id
	LEFT JOIN sys.query_store_runtime_stats rs
		ON rs.plan_id = ql.plan_id
	LEFT JOIN sys.query_store_runtime_stats_interval rsi
		ON rsi.runtime_stats_interval_id = rs.runtime_stats_interval_id
	WHERE
		rsi.end_time > @StartDate
	ORDER BY
		qt.query_sql_text,
		rsi.end_time;
GO

EXEC dbo.QS_GetProcedurePerfDetails
  @Schema_Object = 'dbo.User_GetByReputation',
  @StartDate = '2023-05-24';
GO

I’m checking to see if the compatibility level is at least 160 as a way to see if we are on SQL Server 2022 or not. Of course, we could be using SQL Server 2022 with a lower compatibility level, but the sys.query_store_query_variant table would be empty in that case.

The key is to have an initial step to get the queries and plans we want. This has a LEFT JOIN to sys.query_store_query_variant in case there are variant queries to consider. We join to get the other details for the variant (the query_text_id, plan_id, and the plan itself) if they exist.

I’m throwing those initial results in a temp table to use in the final query. I’ve also found in my testing that splitting this operation in two helps to prevent the plan from getting too large and sluggish.

The temp table is populated with the details of the variant query and its “Query Variant Plan”, if present, but if they are NULL we use the details of what must be a normal query with a “Compiled Plan”.

From here, you can also get more complex and include options to aggregate the Query Store details or include more columns, but this should solidify how to incorporate sys.query_store_query_variant into your scripts.

In Summary

This is something I’ve been working on for a while. It became obvious to me months ago that we needed to include this logic at work so that our own Query Store aggregation wouldn’t suddenly miss a lot of executions.

Hopefully, this post will help some readers to avoid this pitfall.

You can follow me on Twitter (@sqljared) and contact me if you have questions. My other social media links are at the top of the page. Also, let me know if you have any suggestions for a topic for a new blog post.

Addendum

As I pointed out in my next post, the join I originally made to sys.query_store_query_variant was incorrect. If you only join based on the query_id, the result set gets multiplied. Each variant query is shown as related to all plans for the parent query, even “compiled plan” type plans which do not use PSPO at all.

I’ve updated the scripts above in two places, but wanted to call that out.

Parameter sniffing (for the uninitiated)

Parameter sniffing is a well-known issue within SQL Server. Imagine you have a query that can return a wildly varying number of rows. For example, a query that returns all orders in your system for a given customer. Most of your customers have a few orders, several have a lot, and one huge customer has tons of orders.

When the query is executed for the first time, SQL Server will estimate the number of rows the query will return based on the customer_id and create a plan based on that estimate.

If you wanted the details for a small account, the plan will be optimized for a small number of rows (assuming your statistics are accurate) and will be more likely to have nested loops and key lookups. Those operations are fine for small result sets but less efficient for large result sets.

If you called to get details for your largest account, you’ll get a plan that is optimized for a huge number of rows; likely using an index\table scan or maybe a hash match join instead of nested loops.

But the plan will be compiled for the first execution, and hopefully reused after that. If the plan is geared toward a small result set, it will perform poorly for the large account, and vice versa.

You can minimize the effect of parameter sniffing using WITH RECOMPILE or OPTIMIZE FOR hints, but look at an example of parameter sniffing using WideWorldImporters.

USE WideWorldImporters
GO
CREATE OR ALTER PROCEDURE Sales.GetOrders
	@CustomerID INT
AS

	SELECT *
	FROM Sales.Orders so
	WHERE
		so.CustomerID = @CustomerID;
GO

I added some more data to the table, all under one CustomerID, to change its statistics. CustomerID 90 has been very busy.

If I run this simple procedure for CustomerID 13, we’ll get a plan well suited to it, and the estimates are accurate.

EXEC Sales.GetOrders @CustomerID = 13; -- 13 or 90
GO 

If we try again but with CustomerID 90, we use the same plan and estimate the same number of rows. But nested loops and a key lookup probably shouldn’t be the plan when we are returning over 100,000 rows.

This is an example of parameter sniffing. Our plan is going to be defined largely by the parameters we use when the procedure gets compiled.

Variant Queries

Parameter Sensitive Plan Optimization attempts to solve the parameter sniffing issue by allowing a query to have different plans that are used based on the cardinality of one important parameter. The parent query has a plan that is really just a stub; there can be up to three variant queries that have full execution plans. When the query is executed, the optimizer chooses which variant query and plan to use based on the cardinality of the parameter’s value.

The plans for the parent and variant queries all indicate that PSPO is in use, and show the boundaries for the parameter. There is a low boundary and a high boundary. If the value provided for the parameter should return a small number of rows, less than the low boundary, the appropriate plan is used. If the cardinality for that value is between the two boundaries, another plan is used. If the cardinality is above the high boundary, the third plan is used.

Example

I tried several times but was unable to get PSPO to kick in on this table in WideWorldImporters, so I shifted to using the StackOverflow2013 database.

USE StackOverflow2013;
GO
ALTER DATABASE CURRENT SET COMPATIBILITY_LEVEL = 160; /* 2022 */
GO
ALTER DATABASE StackOverflow2013 SET QUERY_STORE = ON;
GO
ALTER DATABASE StackOverflow2013 SET QUERY_STORE (OPERATION_MODE = READ_WRITE, QUERY_CAPTURE_MODE = ALL, INTERVAL_LENGTH_MINUTES = 15);
GO
EXEC DropIndexes;
GO
IF NOT EXISTS(
	SELECT 1
	FROM sys.indexes si
	WHERE
		name = 'IX_User_Reputation'
)
BEGIN
	CREATE INDEX IX_User_Reputation ON dbo.Users(Reputation);
END;
GO
CREATE OR ALTER PROCEDURE dbo.User_GetByReputation
  @Reputation int
AS
	SELECT 
		u.AccountId,
		u.DisplayName,
		u.Views,
		u.CreationDate
	FROM dbo.Users u
	WHERE 
		u.Reputation=@Reputation;
GO

I’ve seen a few other blogs use Reputation as an example, and it seems its histogram is in a good state for the optimizer to choose PSPO.

You can see from the query text at the top of the plan that the system has added an OPTION hint for “PLAN PER VALUE”. This is specifying which of the variant plans to use for this parameter.

If you look in the XML, you will also see a block like this one when PSPO is in use:

<StmtSimple StatementCompId="4" StatementEstRows="7173" StatementId="1" StatementOptmLevel="FULL" CardinalityEstimationModelVersion="160" StatementSubTreeCost="21.8786" StatementText="SELECT &#xD;&#xA;		u.AccountId,&#xD;&#xA;		u.DisplayName,&#xD;&#xA;		u.Views,&#xD;&#xA;		u.CreationDate&#xD;&#xA;	FROM dbo.Users u&#xD;&#xA;	WHERE &#xD;&#xA;		u.Reputation=@Reputation option (PLAN PER VALUE(ObjectID = 1237579447, QueryVariantID = 2, predicate_range([StackOverflow2013].[dbo].[Users].[Reputation] = @Reputation, 100.0, 1000000.0)))" StatementType="SELECT" QueryHash="0x08FD84B17223204C" QueryPlanHash="0x2127C7766B9DDB3C" RetrievedFromCache="true" StatementSqlHandle="0x0900A6524A0ECC5A61EA55C6320D3963E1D20000000000000000000000000000000000000000000000000000" DatabaseContextSettingsId="1" ParentObjectId="0" StatementParameterizationType="1" SecurityPolicyApplied="false">
          <StatementSetOptions ANSI_NULLS="true" ANSI_PADDING="true" ANSI_WARNINGS="true" ARITHABORT="true" CONCAT_NULL_YIELDS_NULL="true" NUMERIC_ROUNDABORT="false" QUOTED_IDENTIFIER="true" />
          <Dispatcher>
            <ParameterSensitivePredicate LowBoundary="100" HighBoundary="1000000">
              <StatisticsInfo Database="[StackOverflow2013]" Schema="[dbo]" Table="[Users]" Statistics="[IX_User_Reputation]" ModificationCount="0" SamplingPercent="100" LastUpdate="2023-05-19T14:04:14.91" />
              <Predicate>
                <ScalarOperator ScalarString="[StackOverflow2013].[dbo].[Users].[Reputation] as [u].[Reputation]=[@Reputation]">
                  <Compare CompareOp="EQ">
                    <ScalarOperator>
                      <Identifier>
                        <ColumnReference Database="[StackOverflow2013]" Schema="[dbo]" Table="[Users]" Alias="[u]" Column="Reputation" />
                      </Identifier>
                    </ScalarOperator>
                    <ScalarOperator>
                      <Identifier>
                        <ColumnReference Column="@Reputation" />
                      </Identifier>
                    </ScalarOperator>
                  </Compare>
                </ScalarOperator>
              </Predicate>
            </ParameterSensitivePredicate>
          </Dispatcher>

The “ScalarOperator ScalarString” shows us the column and parameter our plan optimization is focusing on. We can see the index\statistic being used after the StatisticsInfo clause a few lines above; it also shows the sampling rate for that statistic.

The LowBoundary and HighBoundary values define the three ranges for parameter-sensitive plan optimization. If the optimizer estimates rows below the LowBoundary (which has always been 100 in examples I have seen), we will use the first variant. If the estimate is between the boundaries, we use the second. If it’s above the HighBoundary (which has been 100,000 or 1,000,000 in every case I’ve seen), we use the third.

In this case, we used VariantID 2 because we estimated 7173 rows.

One Problem

But as Brent Ozar points out here, there is still parameter sniffing going on. And if you are reading about the subject here, you should also read Brent’s post.

The low boundary I’ve always seen is 100, but there may be some variety there. So, if a query is executed using PSPO with a parameter that has a cardinality of less than 100, SQL Server will use the plan for that smallest range. If the parameter leads to an estimate of 5 rows, we’ll compile and execute that query and reuse the plan for subsequent low cardinality parameters. If the query is executed again with a parameter that should read 80 rows, we’ll use the same plan. But I would expect the optimal plan for those two parameters to be the same, or at least fairly similar. Nested loops and a key lookup won’t hurt here, since we aren’t talking about many rows in either case.

I would think the same for the high boundary, which I’ve seen as 100,000 or 1,000,000 in every case I’ve seen so far. Let’s assume the high boundary is 100,000. If the query is executed, and we estimate 250,000 rows to be returned, we’re likely to have a plan with a scan or hash match in it; maybe we’ll see parallelism. If the query is executed again and 1.5 million rows are expected, the plan is likely to be similar even if the memory allocation is too low.

My concern is for the middle range. A plan intended when we estimate 200 rows to be returned should be very different from a plan expecting 90,000 rows. So it seems more likely that there will be parameter sniffing in that middle range because there’s a large relative difference between the cardinality values within that range. So if parameter sniffing has a minimal effect on the high and low ranges, the improvement made by PSPO for a given query will depend on how many values fall into that middle range.

Summary

I wanted to do a post on the topic as is, before going into a problem that is potentially serious. I’ll cover that in the next post where I will talk about the changes in Query Store related to Parameter Sensitive Plan Optimization. There are changes in other system tables, but I will focus on Query Store because I use it daily.

You can follow me on Twitter (@sqljared) and contact me if you have questions. My other social media links are at the top of the page. Also, let me know if you have any suggestions for a topic for a new blog post.