In my most recent blog post, I looked at the Query Variation report, which compares the recent performance of queries versus their historical performance to either highlight improvements or regressions in performance. The Waits Variation component does the same, but comparing the recent waits for a query to its historical waits.

One thing to keep in mind, is that if a given query is changed in any way (to change the filter, return additional columns, or include a hint), the changed query will have a different query_id in Query Store. In which case, both the Waits Variation and Query Variation procedures will not compare the historical performance of the old query to the recent performance of the new one.

That being said, let’s look at the dbo.WaitsVariation procedure’s options.

Waits Variation Options

  • @ServerIdentifier: Defaults to the current instance. Set this to gather data from another instance of SQL Server.
  • @DatabaseName: Defaults to the current database. I’m querying data from WideWorldImporters for my examples.
  • @ReportIndex: Default NULL. When used, stores information about the parameters used for the report.
  • @ReportTable: Default NULL. Allows you to store the report data in a table like dbo.WaitsVariationStore, created by the installer.
  • @WaitType: Which wait category are we concerned with? Total by default. [Total, CPU, Lock, Latch, BufferLatch, BufferIO, WorkerThread, NetworkIO, Parallelism…] There are 36 options here, so check the header of dbo.WaitsVariation for the full list.
  • @Metric: Do we want to compare the total wait time for the query, or the average? Avg by default. [Avg, Total]
  • @VariationType: Are we looking for queries that have improved [I] or regressed [R]. ‘R’ by default.
  • @ResultsRowCount: Number of rows to include in the report. Only the largest regressions or improvements are included. Default is 25, and if this value is NULL or negative, the procedure uses the default.
  • @RecentStartTime and @RecentEndTime: Defines what the ‘recent’ period is, which will be compared against the historical. The defaults are 1 hour ago for @RecentStartTime, and now for @RecentEndTime.
  • @HistoryStartTime and @HistoryEndTime: Defines what the ‘history’ period is, which will be compared against the recent. The defaults are 30 days ago for @HistoryStartTime, and 1 hour ago for @HistoryEndTime.
  • @IncludeQueryText: Includes the text for any identified queries in the output. Default is 0.
  • @ExcludeAdhoc: Ignores ad hoc queries, anything that isn’t part of a procedure or other defined object. Default is 0.
  • @ExcludeInternal: Excludes internal queries\operations run by SQL Server itself. Default is 0.
  • @VerboseMode: Default 0. Provides the queries being used in the messages tab.
  • @TestMode: Default 0. When enabled, does everything except actually run the generated queries to create the report.
  • OUTPUT @ReportID: When you @ReportIndex and @ReportTable, a saved report is generated. You can then use the @ReportID to see that report separately.

So, these parameters are very similar to dbo.QueryVariation. You’ll likely want to alter your time parameters, and you could generate multiple reports to check different wait types. Or you could do a regular report for total waits, and review to see which type of wait had the biggest change.

Best Total Wait Improvement

Given that the default is to look for regressions instead of improvements, if I wanted to compare the last two day’s waits to the previous month, I could use the following:

DECLARE @RecentStartTime	DATETIME2 = DATEADD(HOUR, -48, GETUTCDATE());
DECLARE @RecentEndTime	DATETIME2 = GETUTCDATE();
DECLARE @HistoryStartTime	DATETIME2 = DATEADD(DAY, -30, @RecentEndTime);
DECLARE @HistoryEndTime	DATETIME2 = @RecentStartTime;

	EXECUTE [dbo].[WaitsVariation]
		@DatabaseName	= 'WideWorldImporters',
		@WaitType	= 'Total',
		@Metric		= 'Avg',
		@VariationType = 'I',
		@ExcludeAdhoc = 1,
		@HistoryStartTime = @HistoryStartTime,
		@HistoryEndTime	= @HistoryEndTime,
		@RecentStartTime = @RecentStartTime,
		@RecentEndTime = @RecentEndTime;

Choosing ‘Total’ as your @Metric may work for some cases, but would tend to give results with large variation. If a query executed more times in one period than the other, I would expect that period to have more waits.

I ran a workload to generate some activity, and only one query in it regressed, so I’m returning improvements so there’s a little more to look at.

Wait Variation – Improvements

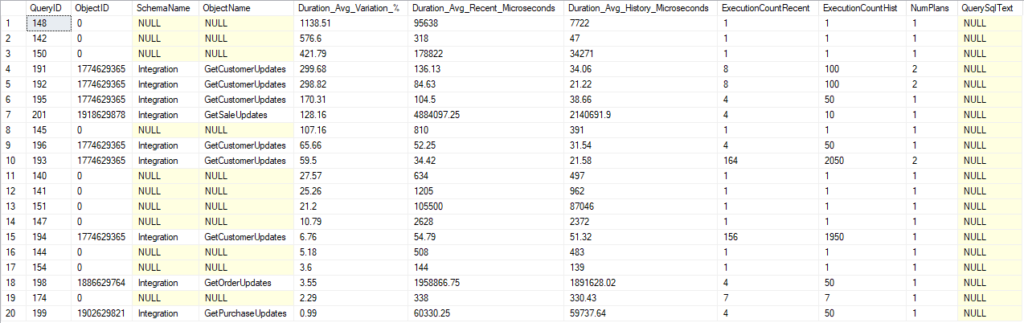
So, the four procs listed had some rather dramatic improvements. We can see the amount of the total wait reduction, and columns for unknown and CPU waits. This is only a portion of the incredibly wide result set. There are history, recent, and variation % columns for each wait type.

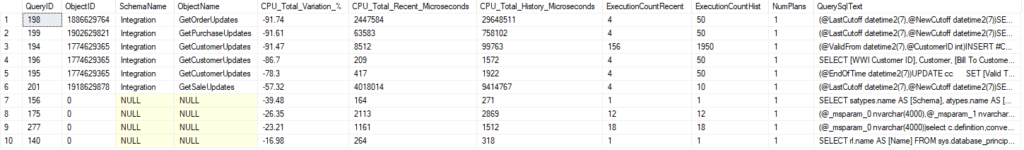
We ran this script looking for ‘Total’ as our @WaitType, which means we are sorting and returning the top rows with the most improvement in that area. But it did record the improvement for all wait types. It only takes a little scrolling to find our causes:

Wait Variation – Causes

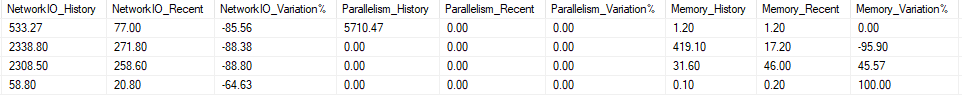
So, the first procedure had relatively large parallelism waits in its history, compared with none in the recent period. I would argue the variation % should be 100% not 0%, but the logic here may be special to prevent us from diving by 0.

All four procedures had NetworkIO waits. It’s likely the tool I was using to run these queries in a loop was not consuming the results fast enough, causing delays within SQL Server. These queries were taking so long that I used a smaller date range on my more recent calls. Fewer records, less time for the app to consume them, and smaller NetworkIO waits.

One thing I have noticed is that if you use @IncludeQueryText, the text returned is compressed and unreadable. Unless you create a saved report by using the @ReportIndex and @ReportTable options, which leads us to the second procedure.

Waits Variation from Store

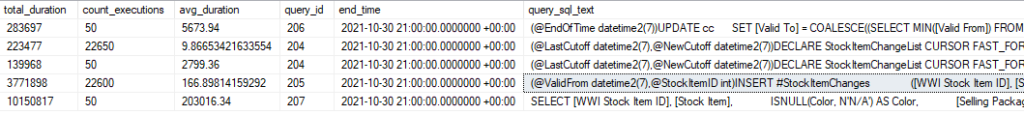
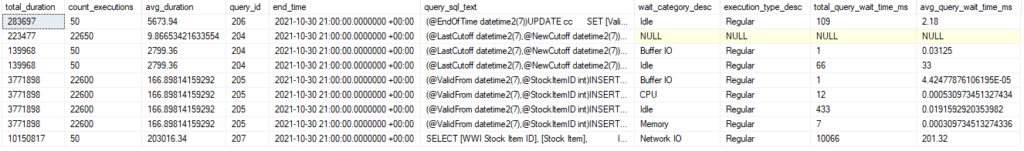
If I save the results, there are records in the tables indicated, I can run dbo.WaitsVariationFromStore to read out the header of the report and its details in two result sets.

Waits Variation from Store output

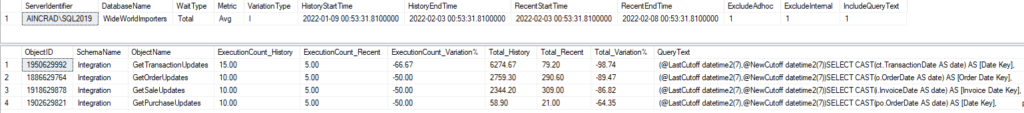
The result set is much more limited, but focuses on the metric we chose. We can see the number of executions, the related object, the change in our totals waits, and the decompressed text for the query itself.

There are only three parameters for this proc, but here’s an example:

USE QDSToolBox
GO

	EXECUTE dbo.WaitsVariationFromStore
		@ReportID = 1,
		@VerboseMode = 0,
		@TestMode = 0;

Nearly done

There are two more components to the QDS Dashboard I want to detail, but I may be spreading them out between some other topics I want to blog on.

Time to go update slides for a user group meeting later this week.

If you have any topics related to performance in SQL Server you would like to hear more about, please feel free to make a suggestion. You can follow me on twitter (@sqljared) and contact me if you have questions.

Since Query Store stores statistics long term, we can use it to look for trends or major changes in performance. The Query Variation component of the QDS Toolbox helps us review changes and has a lot of options to allow us to select the kinds of changes we are interested in.

So, let’s review our options and go through some examples.

Options

Let’s discuss the options and how they interact.

  • @ServerIdentifier: Defaults to the current instance. Set this to gather data from another instance of SQL Server.
  • @DatabaseName: Defaults to the current database. I’m querying data from WideWorldImporters for my examples.
  • @ReportIndex: Default NULL. When used, stores information about the parameters used for the report.
  • @ReportTable: Default NULL. Allows you to store the report data in a table like dbo.QueryVariationStore, created by the installer.
  • @Measurement: What statistic are we basing our report on? CPU by default. [CLR, CPU, DOP, Duration, Log, LogicalIOReads, LogicalIOWrites, MaxMemory, PhysicalIOReads, Rowcount, TempDB]
  • @Metric: How are we comparing our measurements? Avg by default. [Avg, Max, Min, StdDev, Total]
  • @VariationType: Are we looking for queries that have improved [I] or regressed [R]. ‘R’ by default.
  • @ResultsRowCount: Number of rows to include in the report. Default is 25.
  • @RecentStartTime and @RecentEndTime: Defines what the ‘recent’ period is, which will be compared against the historical. The defaults are 1 hour ago for @RecentStartTime, and now for @RecentEndTime.
  • @HistoryStartTime and @HistoryEndTime: Defines what the ‘history’ period is, which will be compared against the recent. The defaults are 30 days ago for @HistoryStartTime, and 1 hour ago for @HistoryEndTime.
  • @MinExecCount: Only considers queries with at least this many recent executions. Default is 1.
  • @MinPlanCount and @MaxPlanCount: Only includes queries with a number of plans in this range. Defaults are 1 and 99999.
  • @IncludeQueryText: Includes the text for any identified queries in the output. Default is 0.
  • @ExcludeAdhoc: Ignores ad hoc queries, anything that isn’t part of a procedure or other defined object. Default is 0.
  • @ExcludeInternal: Excludes internal queries\operations run by SQL Server itself. Default is 0.
  • @VerboseMode: Default 0. Provides the queries being used in the messages tab.
  • @TestMode: Default 0. When enabled, does everything except actually run the generated queries to create the report.

So let’s look at a few examples Pablo Lozano put in the header for the procedure.

Worst Regressions

The first example using the Query Variation proc creates a list of the 25 queries with the largest regression in performance for the last hour, compared to the history over the last 30 days.

	EXECUTE [dbo].[QueryVariation]
		@DatabaseName	= 'WideWorldImporters',
		@Measurement	= 'Duration',
		@Metric			= 'Avg';

We’re relying a lot on default values here, but it shows how simple it can be to run this procedure and get usable results.

Our results include queries that are in procedures and those that aren’t. We have the QueryID values for each if we want to run another query to look them up, but we didn’t include the option to get the text for the statements.

Since the default is to look for regressed queries, our list has 25 queries in descending order based on how large the regression was. We can see the average duration recently and historically, the number of executions is each window, and the overall number of plans.

The first two queries on this list from Integration.GetCustomerUpdates both have regressed by almost 300%. Both also have two execution plans. That could be the explanation for their regression; we could have a new plan that is worse for a variety of reasons. We also are comparing 8 recent executions to 100 in our history, so it could just be the small sample size (or cold cache) is making a big difference.

We have the information we need here to find the query and follow up from there. I’m fond of using the “Tracked Queries” report in SSMS under Query Store, and that would show us the query and it’s recent plans.

Biggest CPU Improvements

Here’s the second example from the procedure’s comments.

		EXECUTE [dbo].[QueryVariation]
			@DatabaseName	= 'WideWorldImporters',
			--@ReportIndex		= '[dbo].[QueryVariationIndex]',
			--@ReportTable		= '[dbo].[QueryVariationReport]',
			@Measurement		= 'CPU',
			@Metric				= 'Total',
			@VariationType		= 'I',
			@ResultsRowCount	= 10,
			@MaxPlanCount		= 1,
			@IncludeQueryText	= 1;

I’ve added my database name and left the report tables in comments, and I did change the option to include query text.

This report should show us queries that have improved the most, based on total CPU usage. It will only give us 10 results, and only includes query with a single plan.

Results here are showing us procedure with the biggest reduction in overall CPU usage, and several are around 90%. But, that’s not surprising since we measured off the total numbers instead of average, and we’ve run the queries far less in the recent window. If we run the query 92% less in the recent window, this will show up as a reduction.

If our executions were more even, it could draw attention to statements that have improved despite the plan not changing, since we set our @MaxPlanCount to 1.

The QuerySQLText has information on variables at the beginning, but we see which statement is being referred to by each line of the report.

Query Variation Usage

The Query Variation report is good for a general comparison of performance. Run this daily, check your average duration\CPU\logical IO reads against the historical to look for regressions, and you get a good list of queries and procs you may want to look into.

Do keep in mind that you can’t use this check the results of a change to a query. If you are changing the text of a statement in any way, the modified statement is a different query_id in Query Store. So this report wouldn’t compare it to the original statement.

This can identify queries that have a change in performance because of a new plan, depending on how you set the @MaxPlanCount. So if you are changing an index to improve a query, a query variation report could show the statement’s improvement (or regression).

Speaking at SQL Friday this week

If you are not aware of SQL Friday, there’s a talk done online live every week at noon CET (GMT +6). You can also view previous sessions through links here.

I’ll be speaking this week with a case study on optimizing a very frequently run procedure. It is the same subject I presented at Virtual PASS 2021.

I have a few more blogs coming on the QDS Dashboard, and a few other topics I’m likely to write on soon. If you have any topics related to performance in SQL Server you would like to hear more about, please feel free to make a suggestion. You can follow me on twitter (@sqljared) and contact me if you have questions.

In contrast to the previous QDS Toolbox components, this one is relatively simple. Instead of a tool that’s ready to be scheduled to give you a report, this just adds the dbo.query_store_wait_stats_pivoted view.

So, what’s the value here?

The typical case

The way I use Query Store most often, is to investigate the performance of a specific procedure or statement. I tend to do this when I know there is an issue, or when I want to evaluate the improvement of a new change.

Here’s a query I’ll often run (or some variation thereof):

--Statement numbers for the last two hours, no aggregation
SELECT 
	qrs.avg_duration * qrs.count_executions AS total_duration,
	qrs.count_executions, 
	qrs.avg_duration, 
	qsq.query_id,
	qsi.end_time,
	qt.query_sql_text, 
	qsq.query_hash
FROM sys.query_store_query qsq 
JOIN sys.query_store_query_text qt 
	ON qt.query_text_id = qsq.query_text_id
JOIN sys.query_store_plan qp 
	ON qp.query_id = qsq.query_id
JOIN sys.query_store_runtime_stats qrs 
	ON qp.plan_id = qrs.plan_id
JOIN sys.query_store_runtime_stats_interval qsi
	ON qsi.runtime_stats_interval_id = qrs.runtime_stats_interval_id
WHERE 
	qsq.object_id = OBJECT_ID('Integration.GetStockItemUpdates')
	AND qsi.end_time > DATEADD(hour, -2, GETUTCDATE())
	--AND qt.query_sql_text LIKE '%something%'
ORDER BY 
	qt.query_sql_text, 
	qsq.query_id,
	qsi.end_time

Now, Query Store’s performance statistics are separated into intervals. We can set the size for an interval when we turn on Query Store (60 minutes by default, I have it at 15 on my test environment). So, this query will show me the performance of each statement for each interval over the last two hours.

Sometimes I’ll aggregate the data so I can look at the averages over several days, but sometimes I like seeing each interval to see if there is a lot of variation.

So, here’s that result set:

Runtime Stats from Query Store

sys.query_store_wait_stats

But let’s say we look at this data and are concerned one of these statements is taking longer than expected, and we want to see if it is waiting on anything. So, we take that query and add a join to sys.query_store_wait_stats. Seems simple enough.

--Statement numbers for the last two hours, no aggregation, with wait stats for one statement
SELECT 
	qrs.avg_duration * qrs.count_executions AS total_duration,
	qrs.count_executions, 
	qrs.avg_duration, 
	qsq.query_id,
	qsi.end_time,
	qt.query_sql_text, 
	ws.wait_category_desc,
	ws.execution_type_desc,
	ws.total_query_wait_time_ms,
	ws.avg_query_wait_time_ms
FROM sys.query_store_query qsq 
JOIN sys.query_store_query_text qt 
	ON qt.query_text_id = qsq.query_text_id
JOIN sys.query_store_plan qp 
	ON qp.query_id = qsq.query_id
JOIN sys.query_store_runtime_stats qrs 
	ON qp.plan_id = qrs.plan_id
JOIN sys.query_store_runtime_stats_interval qsi
	ON qsi.runtime_stats_interval_id = qrs.runtime_stats_interval_id
LEFT JOIN sys.query_store_wait_stats ws
	ON ws.plan_id = qrs.plan_id
	AND ws.runtime_stats_interval_id = qsi.runtime_stats_interval_id
WHERE 
	qsq.object_id = OBJECT_ID('Integration.GetStockItemUpdates')
	AND qsi.end_time > DATEADD(day, -2, GETUTCDATE())
ORDER BY 
	qt.query_sql_text, 
	qsq.query_id,
	qsi.end_time,
	ws.wait_category_desc

And let’s see our results:

Runtime Stats with Wait Stats

Now we have 9 rows instead of 5. And the number under avg_duration look redundant.

What’s happened, is that sys.query_store_wait_stats has multiplied our result set. Since it stores a record for each wait type observed in each interval, we have multiple combined rows for several of these intervals. And one of our rows would have been removed from this set if we didn’t LEFT JOIN to sys.query_store_wait_stats, since it had no waits.

This is probably not how you would image it to work on first glance. And you might want to pivot those results instead, but the Pivoted Wait Stats view has done that for you.

Using Pivoted Wait Stats

If I take my original query and join to dbo.query_store_wait_stats_pivoted, I will get one row of output for each plan_id and runtime_stats_interval_id.

And the result set will be rather wide. There’s a total and average column for each wait type in sys.query_store_wait_stats. You may or may not want to include all in your query.

So, here’s an example with the average for several interesting wait types:

--Statement numbers for the last two hours, no aggregation
SELECT 
	qrs.avg_duration * qrs.count_executions AS total_duration,
	qrs.count_executions, 
	qrs.avg_duration, 
	qsq.query_id,
	qsi.end_time,
	qt.query_sql_text, 
	wsp.Average_BufferIO,
	wsp.Average_BufferLatch,
	wsp.Average_CPU,
	wsp.Average_Lock,
	wsp.Average_Memory,
	wsp.Average_NetworkIO,
	wsp.Average_Parallelism,
	wsp.Average_Tracing
FROM sys.query_store_query qsq 
JOIN sys.query_store_query_text qt 
	ON qt.query_text_id = qsq.query_text_id
JOIN sys.query_store_plan qp 
	ON qp.query_id = qsq.query_id
JOIN sys.query_store_runtime_stats qrs 
	ON qp.plan_id = qrs.plan_id
JOIN sys.query_store_runtime_stats_interval qsi
	ON qsi.runtime_stats_interval_id = qrs.runtime_stats_interval_id
LEFT JOIN dbo.query_store_wait_stats_pivoted wsp 
	ON wsp.plan_id = qp.plan_id
	AND wsp.runtime_stats_interval_id = qrs.runtime_stats_interval_id
WHERE 
	qsq.object_id = OBJECT_ID('Integration.GetSaleUpdates')
	AND qsi.end_time > DATEADD(day, -5, GETUTCDATE())
ORDER BY 
	qt.query_sql_text, 
	qsq.query_id,
	qsi.end_time

Runtime Stats with Pivoted Wait Stats

We have one record for this query for each of three intervals. In each row, I can see the average wait time for CPU, disk (BufferIO), buffer latch, and other waits. In this case, the largest waits were with NetworkIO. Likely, SSMS was having trouble keeping up with displaying multiple result sets, because I ran this batch 50 times in a row.

One last thing, keep in mind the times from the main tables in Query Store like sys.query_store_runtime_stats are reported in microseconds, while the wait tables are in milliseconds whether you use sys.query_store_wait_stats or dbo.query_store_wait_stats_pivoted. A query that takes 7,000,000 microseconds to run but waited for CPU time for 6,900 milliseconds spent nearly its entire duration waiting.

Don’t forget about PASS Data Community Summit 2021!

PASS Data Community Summit 2021 is next week, and the event is virtual and free, so please go and register if you haven’t already. I’m happy to see PASS and the summit are Red Gate’s hands, and expect it to be a great event.

Many of the sessions, including my session, are prerecorded and can be watched at any time. This should make it easier to get around conflicts between sessions you want to hear. There are also Q&A sessions for the prerecorded sessions, and those are scheduled and live. So get registered and make sure you don’t miss out.

If you have any topics related to performance in SQL Server you would like to hear more about, please feel free to make a suggestion. You can follow me on twitter (@sqljared) and contact me if you have questions.

When configuring Query Store, we have a few options for deciding how it retains data but little control over how it cleans up that data. We can set the max size of our query store, the max number of plans to keep per query, and how long to keep query statistics.

The QDS Cache Cleanup component of the QDS Toolbox gives us a number of other options for what data to remove:

  • Internal queries
  • Adhoc queries
  • Orphaned queries (from deleted stored procedure and other dropped objects)
  • Queries that have not run recently
  • Target queries with fewer than X executions
  • Remove only stats associated with targeted queries

Performance

There was a performance issue where I work that related to the QDS size-based cleanup that Mark Wilkinson discusses here. There were a number of symptoms and issues seen at the time and hats off to our DBAs for determining the root cause. This is something I wanted to highlight.

These issues didn’t start until QDS started hitting max size, so that was over a month in some cases, and it didn’t hit all instances and databases at the same time. This means the issue seemed “random” when it was happening.

Mark Wilkinson

Using the QDS Cache Cleanup, you can prevent the typical size-based cleanup from running, while having more control on what gets cleaned up. The procedure provided will identify which queries or stats in Query Store to remove, then calls system procedures to remove them:

  • sp_query_store_unforce_plan
  • sp_query_store_remove_query
  • sp_query_store_reset_exec_stats

Options

Let’s discuss the options and how they interact.

  • @InstanceIdentifier: You can use this to gather data from another instance of SQL Server.
  • @DatabaseName: Defaults to the current database. I keep my QDS data in a separate database, so I will use it in my examples.
  • @CleanAdhocStale: Binary option; default is 0. Setting this to 1 will clean up data related to any stale queries that are ad-hoc queries, i.e. not associated with an object like a stored procedure. Only stale ad-hoc queries are affected, as defined by the @Retention and @MinExecutionCount.
  • @CleanStale: Binary option; default is 1. Cleans up all stale queries. Also depends on the settings for @Retention and @MinExecutionCount.
  • @Retention: This setting helps define which queries are considered “stale”. Takes in a number of hours since the query was last run. The default is 168 hours (a week), meaning any query that had run in the last week would not count as stale. If you set this to 0, it will include all queries that match the @CleanStale/@CleanAdhocStale options.
  • @MinExecutionCount: Queries with fewer than this many executions are stale. Default is 2. So, if we take both default options, this will clean up queries with less than 2 executions and anything that has not run in the last week. Setting this to 0, again, would include all queries or all ad-hoc queries.
  • @CleanInternal: Binary option; default is 1. Cleans up any internal queries. This includes queries being run by SQL Server itself to do things like update statistics, and is based on a filter on sys.query_store_query.is_internal_query. This isn’t a “stale” option, so @Retention and @MinExecutionCount don’t affect this.
  • @CleanOrphan: Binary option; default is 1. Cleans up any queries that are associated with an object that no longer exists.
  • @CleanStatsOnly: Binary option; default is 0. When enabled, this option doesn’t remove the query and plan, but uses sp_query_store_reset_exec_stats to remove the statistics for any targeted queries. When not enabled, the default behavior unforces any forced plans with sp_query_store_unforce_plan, and then removes the query, its plans, and its execution statistics with sp_query_store_remove_query. Applies to any query included by the above options.
  • @ReportAsText and @ReportAsTable: Both default to 0. You can enable either or both to get details on the amount of space recovered from the cleanup, in whichever format you prefer.
  • @ReportIndexOutputTable: Default NULL. Setting this allows you to store the report data in a table like dbo.QDSCacheCleanupIndex, created during setup.
  • @ReportDetailsAsTable: Default 0. When enabled, returns details about each query being deleted from Query Store.
  • @ReportDetailsOutputTable: Default NULL. allows you to store the report details in a table like dbo.QDSCleanSummary, created during setup.
  • @TestMode: Default 0. Doesn’t actually delete data, but provides output as though it does. You could use this to see what the effect of a given set or parameters would be before actually taking a destructive action.
  • @VerboseMode: Default 0. Provides the queries being used in the messages tab.

One point for clarity, if the @Retention or @MinExecutionCount is 0,

QDS Cache Cleanup examples:

EXECUTE [dbo].[QDSCacheCleanup]
	@DatabaseName = 'WideWorldImporters'
	,@CleanAdhocStale = 0
	,@CleanStale = 1
	,@Retention = 24
	,@MinExecutionCount = 2
	,@CleanOrphan = 1
	,@CleanInternal = 1
	,@ReportAsTable = 1
	,@ReportDetailsAsTable = 1
	,@TestMode = 1;
GO

This is a example execution given in the comments of the procedure. Since this is run in test mode, nothing is actually deleted; the reports provided give information on what would be deleted if we ran this process normally.

CleanAdhocStale is not used, but CleanStale is a superset of it; so stale ad-hoc queries are included with all stale queries. Anything that has been executed at least twice in the last day is not considered stale.

This process does include any queries from dropped objects and any internal queries, regardless of when they were executed.

Report Table

The report from the QDS Cache Cleanup gives one line per type of query affected. The output includes when this was generated and where, along with the count of queries and plans cleaned up and the space that would be recovered.

Report Details Table

The report details shows the object name (where possible), Query ID, LastExecutionTime, ExecutionCount and QueryText for all queries included in the cleanup.

In my case, it found queries from a procedure I was testing recently (though I had to up the execution count so there would be some stale queries). Most of what the QDS Cache Cleanup flagged for deletion were internal queries involved in updating stats. But nothing was removed, since this was still in TestMode.

There were also some stale ad-hoc queries that look like statistics activity (you can see StatMan in the QueryText). These are internal queries but had executed few times and not recently, so they were also flagged as stale.

This raises an important point. Based on the @Retention and @MinExecutionCount options, orphaned or internal queries can count as stale and be included in your cleanup. If either setting is 0, all queries will be included by the QDS Cache Cleanup; essentially a full wipe of Query Store.

Here’s a few more examples with comments:

USE QDSToolBox
GO
	-- Test Mode; no deletion
	-- Includes Stale queries (24 hours or < 20 executions)
	-- Also includes orphaned and internal queries
	-- Provides report, details, and verbose output (Messages tab)
EXECUTE [dbo].[QDSCacheCleanup]
	@DatabaseName = 'WideWorldImporters'
	,@Retention = 24
	,@MinExecutionCount = 20
	,@CleanStale = 1
	,@CleanAdhocStale = 0
	,@CleanOrphan = 1
	,@CleanInternal = 1
	,@ReportAsTable = 1
	,@ReportDetailsAsTable = 1
	,@TestMode = 1
	,@VerboseMode = 1;
GO

	-- Test Mode; no deletion
	-- Only includes orphaned and internal queries
	-- Provides report, details, and verbose output (Messages tab)
EXECUTE [dbo].[QDSCacheCleanup]
	@DatabaseName = 'WideWorldImporters'
	,@CleanStale = 0
	,@CleanOrphan = 1
	,@CleanInternal = 1
	,@ReportAsTable = 1
	,@ReportDetailsAsTable = 1
	,@TestMode = 1
	,@VerboseMode = 1;
GO

	-- Test Mode; no deletion
	-- Disables most default options
	-- Only includes ad-hoc queries only executed once
	--		and not run in the last 24 hours.
	-- Provides report, details, and verbose output (Messages tab)
EXECUTE [dbo].[QDSCacheCleanup]
	@DatabaseName = 'WideWorldImporters'
	,@Retention = 24
	,@MinExecutionCount = 2
	,@CleanStale = 0
	,@CleanAdhocStale = 1
	,@CleanOrphan = 0
	,@CleanInternal = 0
	,@ReportAsTable = 1
	,@ReportDetailsAsTable = 1
	,@TestMode = 1
	,@VerboseMode = 1;
GO

	-- Test Mode; no deletion
	-- @CleanStale = 1, other clean uptions disabled
	-- Setting @Retention or @MinExecutionCount to 0 means all queries are stale
	-- Output table options included but commented.
	-- Provides report, details, and verbose output (Messages tab)
DECLARE
	@ReportID BIGINT;

	EXECUTE [dbo].[QDSCacheCleanup]
		@DatabaseName = 'WideWorldImporters',
		@CleanAdhocStale = 0,
		@CleanStale = 1,
		@Retention = 0,			--	All Queries Stale
		@MinExecutionCount = 0,	--	All Queries Stale
		@CleanOrphan = 0,
		@CleanInternal = 0,
		@CleanStatsOnly	= 0,
		@ReportAsText = 1,
		@ReportAsTable = 1,
		@ReportDetailsAsTable = 1,
		--@ReportIndexOutputTable	= '[dbo].[QDSCacheCleanupIndex]',
		--@ReportDetailsOutputTable	= '[dbo].[QDSCacheCleanupDetails]',
		@TestMode = 1,
		@VerboseMode = 1,
		@ReportID = @ReportID OUTPUT;

SELECT @ReportID;
GO

More to come

Some of the options in the QDS Cache Cleanup didn’t function like I expected at first, so I think this post should be helpful. I’ll continue to post on the QDS Dashboard, but I’ll likely include a few on other topics in the weeks to come.

I will be speaking at PASS Summit, which is free and virtual this year, so please sign up if you haven’t already.

If you have any topics related to performance in SQL Server you would like to hear more about, please feel free to make a suggestion. You can follow me on twitter (@sqljared) and contact me if you have questions.

Query Waits

Carrying on from my previous post on the QDS Toolbox, let’s review the Query Waits component.

This component provides details about the wait types associated with a given object, query, or plan. This doesn’t pull data from the reports generated by the Server Top Queries component; this gets the data directly from the Query Store in the database you specify. So you can use this to review the waits on a given procedure, even if you haven’t generated any reports with Server Top Queries .

That being said, reports from Server Top Queries could identify problem queries and give you the PlanID, QueryID, or ObjectName you need to run the procedure. A query that spends a lot of time waiting would tend to have a higher duration and lower active metrics like CPU usage or logical reads. So those are the queries I would want to run the Query Waits report against.

Syntax

Assuming you installed the QDS Dashboard without issue, let’s look at the options for the procedure. @sqlozano documented these in the header of the procedure, for reference. Here’s an example script:

USE QDSToolBox
GO
DECLARE 
	@StartTime DATETIME2,
	@EndTime DATETIME2;

SELECT
	@StartTime = DATEADD(MONTH,-1,GETUTCDATE()),
	@EndTime = GETUTCDATE();

EXECUTE [dbo].[QueryWaits]
	--@ServerIdentifier = 'ServerName\Instance',
	@DatabaseName	= 'WideWorldImporters',
	--@ReportIndex		= '[dbo].[QueryWaitsIndex]'
	--@ReportTable		= '[dbo].[QueryWaitsStore]'
	@StartTime = @StartTime,
	@EndTime = @EndTime,
	@ObjectName	= 'OnDisk.InsertVehicleLocation'
	--@QueryID	= 172
	--@PlanID	= 178
	--@VerboseMode = 0
	--@TestMode = 0
GO

  • ServerIdentifier: Commented out. I’m gathering data from the instance I’m logged into, which is the default.
  • DatabaseName: I have a separate database for the QDS Toolbox, so I’m using this parameter to get data from the WideWorldImporters database.
  • ReportIndex and ReportTable: You can store the data generated by this procedure, and refer to it later. I’m referencing the two tables created by the scripts included in the toolbox. In the header, Pablo included an example that pushes the data to a centralized server across a linked server. You just need to fully qualify the name, like ‘[LinkedSrv].[LinkedDB].[dbo].[CentralizedQueryWaitsIndex]’. If you skip these options, you’ll just get a result set that won’t be saved.
  • StartTime and EndTime: In my example, I set the EndTime to be current, and the StartTime to be a month ago. So you can specify any reasonable window you want.
  • ObjectName, QueryID, PlanID: Choose 1 only. The procedure will fail with an error if you provide two. Again, the Server Top Queries output will give you options you can use here.
  • Verbose Mode: Allows you to see the TSQL generated to produce the report. You could then tweak that query if you want something different in your result set.
  • TestMode: Enabling this prevents the produced script from actually running.

Output

I used the OnDisk.InsertVehicleLocation procedure originally to populate some data in my database (which is part of the World Wide Importers sample on github). Running the Query Waits report to check it’s behavior, this is what the output looks like.

The PlanID, QueryID, and QueryTextID may or may not be returned depending on the input. If you query for a specific QueryID, but it has many associated PlanIDs, this report will only give you one row per interval because it aggregates all the plans together. If they weren’t aggregated, you could have dozens or hundreds of rows per interval.

The results show the numbers from each time interval within the window specified. The duration and CPU time are included, along with the number of plans and queries executed in that interval.

Then we have a lot of columns indicating waits in various categories (I didn’t even include them all in this image). The names here correspond to the types in the page for sys.query_store_wait_stats, so you will need to refer to the table I’ve linked. The WWI workload driver inserts 120,000 rows by default (across 120 threads), and the first interval has data from running that tool.

The data in sys.query_store_wait_stats is in milliseconds, but other tables with performance data like sys.query_store_runtime_stats are in microseconds. This report multiplies the time from sys.query_store_wait_stats by 1000, so if you compare the waits to the duration they have the same units.

There are 17 milliseconds of waits were in the Idle category; this includes a number of things, and it could also be that the tool itself has some delays between batches.

There are also 21 milliseconds of memory waits. This is another category with a number of specific wait types, but both of these seems inconsequential given the procedure took 10,226 milliseconds in this interval. The vast majority of that overall duration is accounted for by the 10,114 milliseconds of CPU time.

So in this case, waits don’t appear to be the issue.

Wrapping up

If I see a query’s CPU usage is much less than half its duration, I’ll usually consider its waits. This is an important aspect of SQL Server performance, and the Query Waits report here makes this data very accessible.

Two down, six more components in the QDS Toolbox. I’ll keep working on these posts, with a few other topics in between.

I hope you find this post helpful. If you have any topics related to performance in SQL Server you would like to hear more about, please feel free to make a suggestion. You can follow me on twitter (@sqljared) and contact me if you have questions.

The QDS Toolbox

The QDS Toolbox is set of tools that can help you review and store the performance related data in Query Store. This was released by ChannelAdvisor last September thanks to the hard work of a number of my coworkers.

If you aren’t experienced with Query Store, this can provide a good starting point for getting familiar with data that is available and what you can do with it. If you are experienced with Query Store, this may give you an easy way to set up customizable reports that help you find issues and see trends.

The QDS Toolbox has several components, and I intend to post about each in turn. Two new components were added to this recently by @sqlozano (https://www.sqlozano.com/), bringing the current total to eight.

  1. Server Top Queries
  2. Query Waits
  3. QDS Cache Cleanup
  4. Pivoted Waits Stats
  5. Query Variation
  6. Waits Variation
  7. Statistics Used
  8. Plan Miner

Getting Started

First things first, let’s get it downloaded and installed. I’ve linked the github page above. You can download a ZIP of the current package, or you can clone it with GitHub Desktop or a similar tool.

Once you have the package local, there’s an Installer folder. You could install them a la carte, or the QDSToolBox_Installer script will install all of the components. It will prompt you for the instance of SQL Server you want to use as well as the database you want to install it in. I’m putting mine in it’s own database, as I frequently restore other databases (WideWorldImporters, AdventureWorks2014) when I’m testing things.

Moving to Query Store

In my own experience with performance tuning with SQL Server, I started off using Profiler and PSSDiag constantly when I worked for Microsoft. After a number of years, I moved a lot of my focus to using queries against DMVs (Dynamic Management Views). DMVs allowed me to get most of the same data I reviewed from PSSDiag, but I’m able to get that data with a query that takes a few seconds (typically) instead of having to gather a trace for 30 minutes to feel like I have enough data.

By focusing on a DMV like sys.dm_exec_query_stats, you can easily find which queries on your server have the highest CPU usage, duration, or logical reads. This can make if very easy to identify a problem query, and you can find the query even if it isn’t running currently.

The caveat is that the DMVs only track what is in the cache, and once a query’s plan is no longer cached, it’s gone. No historical data is kept in the DMVs, and that’s why I use Query Store almost exclusively these days.

Server Top Queries

This is a great place to start exploring what is available in the QDS Toolbox, because looking for the top resource consuming queries is a common task.

Once you have the tool installed, you can run the dbo.ServerTopQueries to generate reports based on the metric you choose. That report will remain in the database where the QDS Toolbox was installed, and you can review them whenever. Here’s an example execution of the procedure:

USE QDSToolBox
GO
DECLARE 
	@StartTime DATETIME2,
	@EndTime DATETIME2;

SELECT
	@StartTime = DATEADD(DAY,-1,GETUTCDATE()),
	@EndTime = GETUTCDATE();

EXEC dbo.ServerTopQueries
	@ServerIdentifier	= @@SERVERNAME,
	@DatabaseName	= 'WideWorldImporters',
	@ReportIndex	= 'dbo.ServerTopQueriesIndex',	--provide both Report options to store results
	@ReportTable	= 'dbo.ServerTopQueriesStore',	--provide both Report options to store results
	@StartTime		= @StartTime,
	@EndTime		= @EndTime,
	@Top			= 25,
	@Measurement	= 'cpu_time',	--duration, cpu_time, logical_io_reads, logical_io_writes, 
									--physical_io_reads, clr_time, query_used_memory, log_bytes_used, tempdb_space_used
	@IncludeQueryText	= 1, --default: 0
	@ExcludeAdhoc		= 0,
	@ExcludeInternal	= 0,
	@VerboseMode		= 1,
	@TestMode			= 0;

GO

DECLARE
	@LatestReport INT;

SELECT TOP 1
	@LatestReport = tqi.ReportID
FROM dbo.vServerTopQueriesIndex tqi
ORDER BY 
	tqi.CaptureDate DESC;

SELECT *
FROM dbo.vServerTopQueriesStore tqs
WHERE
	tqs.ReportID = @LatestReport
ORDER BY 
	tqs.CPU DESC;
GO

This script will run in the QDSToolbox database and store the report there, but we will be gathering the Query Store data on activity in the WideWorldImporters databse. I’ve just run some scripts there to generate activity.

The @StartTime and @EndTime parameters will restrict us to looking at activity in the last day.

The @ReportIndex and @ReportTable parameter define where we will store the data. I’ve left these at the default names for the tables, as defined by the tool.

The report is going to be focusing on high cpu queries, defined by the @Measurement variable being set to ‘cpu_time’. If I were using this, I’d be very likely to use ‘duration’ and ‘logical_io_reads’ often as a matter of course as well.

The @Top parameter is set to 25, and that’s probably reasonable. If I’m troubleshooting an active problem, I’d be unlikely to look at more than the top 5 queries in whatever metric, but a larger view makes sense for historical purposes.

I’m taking the default option for @ExcludeAdhoc and @ExcludeInternal; if it’s at the top of my CPU usage, I want to see it.

I am setting @IncludeQueryText to 1 so I get the query_store_query_text.query_sql_text details in my report. That may help you identify a specific query. Even without this option the query_store_query.query_text_id will be available, so you could look up the exact query text directly in Query Store.

I’ve also enabled @VerboseMode to see the exact statement used to generate the report. If you are less familiar with Query Store, you might want to review this to see where all the data being used here is found.

With all this, generating the report took less than a second. Certainly you could set up a scheduled take to create a report on CPU activity every day, which you could review\aggregate\splice later. You could create tasks to do the same for ‘duration’ and ‘logical_io_reads’ and have a good set of data to review for potential issues.

Reviewing the report

Here’s a short script to view my latest report and all the data in the dbo.vServerTopQueriesStore view:

SELECT TOP 1
	@LatestReport = tqi.ReportID
FROM dbo.vServerTopQueriesIndex tqi
ORDER BY 
	tqi.CaptureDate DESC;

SELECT *
FROM dbo.vServerTopQueriesStore tqs
WHERE
	tqs.ReportID = @LatestReport
ORDER BY 
	tqs.CPU DESC;
GO

Report Output

Report Details

The result set includes the capture date for the report, which is the same for each row. We also have the server name, database name, and metric used for the report.

The PlanID, QueryID, and QueryTextID are values you can use to get more information directly from Query Store. I frequently use the QueryID in particular with the Tracked Queries interface in SQL Server Management Studio to look at the plan for a query I’ve already identified.

Object Details

We will see the ObjectName, ObjectID, and SchemaName for any queries that are part of a procedure, function, or other object.

The ExecutionTypeDesc here indicates these queries ran successfully. This value could also be ‘Aborted’ (for a timeout) or ‘Exception’ (for an error).

Performance Statistics

And here we have all of our performance statistics along with the query text. I most often look at three of these, but this includes memory usage (in pages), tempdb usage (also in pages), and log bytes.

The execution count is included, so you can use this to calculate averages for any of these measurements. I tend to focus on the queries that have the highest numbers overall, but you may find a query farther down on your list with a longer average duration is more important.

Coming up

These reports will be used as well by other aspects of the QDS Toolkit, so understanding how to create the reports themselves will be necessary for those.

As I’ve said, there are 7 more parts to this tool. I’m planning to do a post on each in the weeks (and months) ahead. I’ll also be doing more “foundation” posts like my last post on key lookups.

I hope you find this post helpful. If you have any topics related to performance in SQL Server you would like to hear more about, please feel free to make a suggestion.

You can follow me on twitter (@sqljared) and contact me if you have questions.