Query Waits
Carrying on from my previous post on the QDS Toolbox, let’s review the Query Waits component.
This component provides details about the wait types associated with a given object, query, or plan. This doesn’t pull data from the reports generated by the Server Top Queries component; this gets the data directly from the Query Store in the database you specify. So you can use this to review the waits on a given procedure, even if you haven’t generated any reports with Server Top Queries .
That being said, reports from Server Top Queries could identify problem queries and give you the PlanID, QueryID, or ObjectName you need to run the procedure. A query that spends a lot of time waiting would tend to have a higher duration and lower active metrics like CPU usage or logical reads. So those are the queries I would want to run the Query Waits report against.
Syntax
Assuming you installed the QDS Dashboard without issue, let’s look at the options for the procedure. @sqlozano documented these in the header of the procedure, for reference. Here’s an example script:
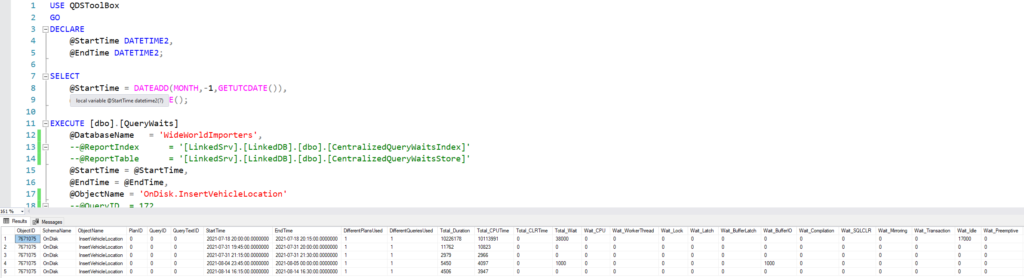
USE QDSToolBox
GO
DECLARE
	@StartTime DATETIME2,
	@EndTime DATETIME2;

SELECT
	@StartTime = DATEADD(MONTH,-1,GETUTCDATE()),
	@EndTime = GETUTCDATE();

EXECUTE [dbo].[QueryWaits]
	--@ServerIdentifier = 'ServerName\Instance',
	@DatabaseName	= 'WideWorldImporters',
	--@ReportIndex		= '[dbo].[QueryWaitsIndex]'
	--@ReportTable		= '[dbo].[QueryWaitsStore]'
	@StartTime = @StartTime,
	@EndTime = @EndTime,
	@ObjectName	= 'OnDisk.InsertVehicleLocation'
	--@QueryID	= 172
	--@PlanID	= 178
	--@VerboseMode = 0
	--@TestMode = 0
GO
- ServerIdentifier: Commented out. I’m gathering data from the instance I’m logged into, which is the default.
- DatabaseName: I have a separate database for the QDS Toolbox, so I’m using this parameter to get data from the WideWorldImporters database.
- ReportIndex and ReportTable: You can store the data generated by this procedure, and refer to it later. I’m referencing the two tables created by the scripts included in the toolbox. In the header, Pablo included an example that pushes the data to a centralized server across a linked server. You just need to fully qualify the name, like ‘[LinkedSrv].[LinkedDB].[dbo].[CentralizedQueryWaitsIndex]’. If you skip these options, you’ll just get a result set that won’t be saved.
- StartTime and EndTime: In my example, I set the EndTime to be current, and the StartTime to be a month ago. So you can specify any reasonable window you want.
- ObjectName, QueryID, PlanID: Choose 1 only. The procedure will fail with an error if you provide two. Again, the Server Top Queries output will give you options you can use here.
- Verbose Mode: Allows you to see the TSQL generated to produce the report. You could then tweak that query if you want something different in your result set.
- TestMode: Enabling this prevents the produced script from actually running.
Output

I used the OnDisk.InsertVehicleLocation procedure originally to populate some data in my database (which is part of the World Wide Importers sample on github). Running the Query Waits report to check it’s behavior, this is what the output looks like.
The PlanID, QueryID, and QueryTextID may or may not be returned depending on the input. If you query for a specific QueryID, but it has many associated PlanIDs, this report will only give you one row per interval because it aggregates all the plans together. If they weren’t aggregated, you could have dozens or hundreds of rows per interval.
The results show the numbers from each time interval within the window specified. The duration and CPU time are included, along with the number of plans and queries executed in that interval.

Then we have a lot of columns indicating waits in various categories (I didn’t even include them all in this image). The names here correspond to the types in the page for sys.query_store_wait_stats, so you will need to refer to the table I’ve linked. The WWI workload driver inserts 120,000 rows by default (across 120 threads), and the first interval has data from running that tool.
The data in sys.query_store_wait_stats is in milliseconds, but other tables with performance data like sys.query_store_runtime_stats are in microseconds. This report multiplies the time from sys.query_store_wait_stats by 1000, so if you compare the waits to the duration they have the same units.
There are 17 milliseconds of waits were in the Idle category; this includes a number of things, and it could also be that the tool itself has some delays between batches.
There are also 21 milliseconds of memory waits. This is another category with a number of specific wait types, but both of these seems inconsequential given the procedure took 10,226 milliseconds in this interval. The vast majority of that overall duration is accounted for by the 10,114 milliseconds of CPU time.
So in this case, waits don’t appear to be the issue.
Wrapping up
If I see a query’s CPU usage is much less than half its duration, I’ll usually consider its waits. This is an important aspect of SQL Server performance, and the Query Waits report here makes this data very accessible.
Two down, six more components in the QDS Toolbox. I’ll keep working on these posts, with a few other topics in between.
I hope you find this post helpful. If you have any topics related to performance in SQL Server you would like to hear more about, please feel free to make a suggestion. You can follow me on twitter (@sqljared) and contact me if you have questions.