In a recent talk with the Sacramento SQL Server User Group (@SACSQLUG), a question was asked I wanted to address, and the answer seemed more like a short blog than a tweet.
I was presenting on how to use the TOP clause to break down large operations into short, fast, bite-sized operations. The mechanics are things I learned from writing processes that do garbage collection, backfill new columns, and anonymizing PII data on existing tables. I’ve just posted the slides and example scripts here if you are interested.
Are they the same?
The question was whether the SET ROWCOUNT command would work just the same, and the answer is sometimes yes but largely no.
SET ROWCOUNT will limit the number of rows returned by the following statements, and this functions like a connection level setting. It will remain in effect until you change it or clear it by setting the rowcount to 0 (unlimited).
I would be concerned about setting the option and not clearing it, causing it to affect additional statements.
So let’s adapt some of my examples and see how it behaves.
The simple case with SET ROWCOUNT
Here’s a script to return 100 rows from a table in WideWorldImporters.
USE WideWorldImporters
GO
SELECT TOP 100
	sol.OrderLineID,
	sol.UnitPrice
FROM Sales.OrderLines sol
WHERE sol.OrderLineID < 1000
	AND sol.UnitPrice > 50;
GO

SET ROWCOUNT 100;

SELECT
	sol.OrderLineID,
	sol.UnitPrice
FROM Sales.OrderLines sol
WHERE sol.OrderLineID < 1000
	AND sol.UnitPrice > 50;
GO
Fairly simple, and the plans are much the same.
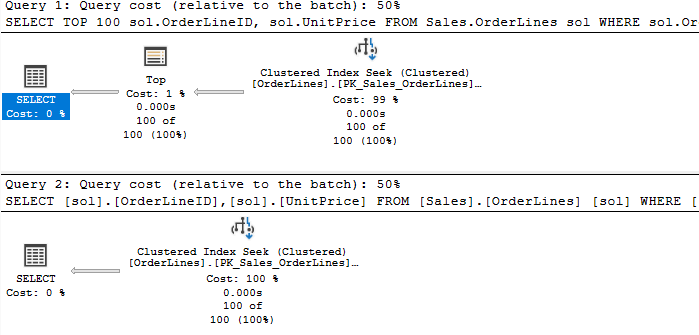
The only difference is that the TOP operator is missing. But the query is behaving much like it is present. I surmise that the SELECT operator itself is limiting the number of rows by not requesting additional data after the first 100.
Quick aside on Row Mode
SQL Server queries typically operate in row mode. Batch mode is used in some cases with columnstore indexes and can be used on rowstore indexes in SQL Server 2019 and above. But I want to focus on how a query processes in row mode (with thanks to Grant Fritchey for his description of this).
The activity is driven by the root node, in this latest plan the Select operator. It asks the operator under it (the Top operator) to go get a row. The Select operator doesn’t really care how that operator does what it does, it just wants a row. And for the Top operator to do it’s job, it asks the operator below it for the same.
Until we get down to the last Nested Loops operator. It asks the Index Scan operator for a row, and that operator can finally get us some data. It returns a row and, being a join operator, Nested Loops asks the Key Lookup for data related to its row. It joins the results and pass the joined row up to the operator above it.
When data flows up to an operator, it will typically reply, “Now give me another row.”
The Top operator changes this be simply not asking for more rows once it has received the number of rows it needs. So all the activity for the underlying operators stops because the Top hasn’t told it to continue.
In the simple example of my two queries, we can see the Clustered Index Seek only returned 100 rows, then the query ended. It seems with SET ROWCOUNT in effect, the Select operator itself stopped the operation by not requesting more data.
But then it falls apart
Here’s a stored procedure I wrote to delete old records from the Sales.Orders table and all related tables.
USE WideWorldImporters
GO
CREATE OR ALTER PROCEDURE Sales.Orders_GarbageCollection(
@BatchSize INT = 100,
@Duration INT = 30
)AS
SET NOCOUNT ON;

	DECLARE
		@NestedTransaction BIT = 0,
		@EndTime DATETIME;

	CREATE TABLE #OrdersGC(
		OrderID INT,
		INDEX IX_OrdersGC(OrderID)
	);

	CREATE TABLE #InvoicesGC(
		InvoiceID INT,
		INDEX IX_InvoicesGC(InvoiceID)
	);

	SET @EndTime = DATEADD(SECOND, @Duration, GETUTCDATE());

	WHILE (GETUTCDATE() < @EndTime)
	BEGIN
		TRUNCATE TABLE #OrdersGC;
		TRUNCATE TABLE #InvoicesGC;

		IF @@NESTLEVEL > 0
		BEGIN
			SET @NestedTransaction = 1;
		END
		ELSE
		BEGIN
			BEGIN TRANSACTION;
		END;

		INSERT INTO #OrdersGC
		SELECT TOP (@BatchSize)
			so.OrderID
		FROM Sales.Orders so
		WHERE
			so.OrderDate <
				DATEADD(month, -50, GETUTCDATE());

		DELETE sol
		FROM #OrdersGC gc
		JOIN Sales.OrderLines sol
			ON sol.OrderID = gc.OrderID;

		INSERT INTO #InvoicesGC
		SELECT --TOP (@BatchSize)
			inv.InvoiceID
		FROM #OrdersGC gc
		JOIN Sales.Invoices inv
			ON inv.OrderID = gc.OrderID;


			DELETE ctr
			FROM #InvoicesGC inv
			JOIN Sales.CustomerTransactions ctr
				ON ctr.InvoiceID = inv.InvoiceID;

			DELETE sti
			FROM #InvoicesGC inv
			JOIN Warehouse.StockItemTransactions sti
				ON sti.InvoiceID = inv.InvoiceID;

			DELETE invl
			FROM #InvoicesGC inv
			JOIN sales.InvoiceLines invl
				ON invl.InvoiceID = inv.InvoiceID;

		DELETE inv
		FROM #OrdersGC gc
		JOIN Sales.Invoices inv
			ON inv.OrderID = gc.OrderID;

		DELETE so
		FROM #OrdersGC gc
		JOIN Sales.Orders so
			ON so.OrderID = gc.OrderID;

		IF @NestedTransaction = 0
		BEGIN
			COMMIT TRANSACTION;
		END;

	END;

GO

BEGIN TRANSACTION

EXEC Sales.Orders_GarbageCollection
	@BatchSize = 100,
	@Duration = 5;

ROLLBACK TRANSACTION
GO


--CREATE INDEX IX_Sales_Orders_OrderDate ON Sales.Orders (OrderDate);
This proc identifies 100 rows in Sales.Orders that we want to delete, and puts those OrderIDs in a temp table. We then delete records from related tables based on those OrderIDs, and we similarly delete records related to rows we want to delete from Sales.Invoices. And this procedure was written to loop and keep deleting records for a specified number of seconds.
One key thing to remember is that we only use a TOP clause when we populate the first temp table. We want to delete those 100 rows and everything related to them, not those 100 rows and only 100 related rows from the related tables. If we only delete some of the related rows, our process will fail on a foreign key violation when we try to delete some rows from the Sales.Orders table.
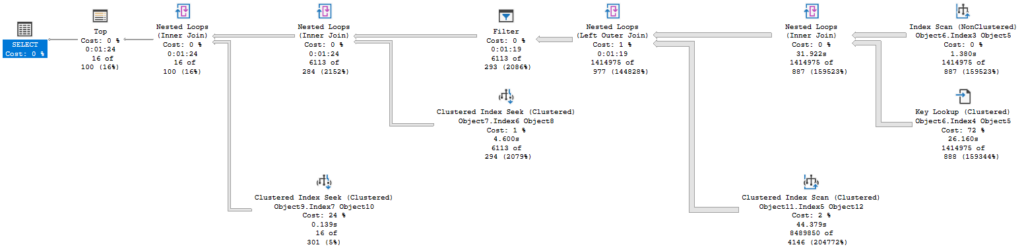
If you were to change this to use a SET ROWCOUNT, you would need to reset that to 0 after the statement inserting into the temp table. If not, the next statement looks like this:
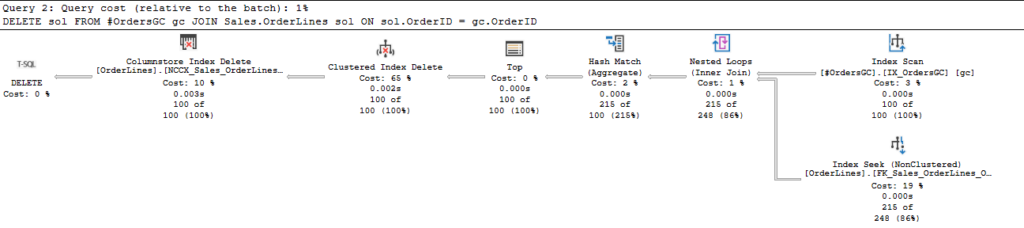
Note the Top operator in this DELETE statement. All is flowing as expected, but then the Top operator shuts this down prematurely. Top only passes on 100 rows, when then get deleted. So, later when we try to DELETE from the Sales.Orders table, we fail because we haven’t deleted all the related rows.
And you could just SET ROWCOUNT 0 once you don’t need it, but I’d be concerned I’d forget to do so and cause issues.
Also, it’s deprecated
If you take a look at the remarks section of the documentation for this statement, there’s something interesting.
Using SET ROWCOUNT will not affect DELETE, INSERT, and UPDATE statements in a future release of SQL Server. Avoid using SET ROWCOUNT with DELETE, INSERT, and UPDATE statements in new development work, and plan to modify applications that currently use it. For a similar behavior, use the TOP syntax. For more information, see TOP (Transact-SQL).
Microsoft
So they aren’t using the word deprecated here, but it amounts to that. This will stop affecting DELETE, INSERT, and UPDATE statements in future, so you wouldn’t want to write a process using SET ROWCOUNT only to have it fail at some undefined point in the future.
It doesn’t state whether this will also affect MERGE statements, but I’d rather not have to use different syntax on some statements anyway, so I’ll just stick with my TOP clauses.
Happy Holidays
Should have another post or two coming in the next few weeks thanks to some extra time off and not traveling much for the holidays. Hope yours are great.
If you have any topics related to performance in SQL Server you would like to hear more about, please feel free to make a suggestion. You can follow me on twitter (@sqljared) and contact me if you have questions.
Also, subscribe to get emails when I post again.