I’ve already posted a blog on page latch waits and some of the ways to minimize them, but I wanted to add some more on the issue. I wanted to test out some strategies to see how effective they are.

Setting up tests can be very difficult in some cases, and this attempt encountered a very unusual problem. At the risk of delaying the intended results, I wanted to point this out. It’s both interesting and frustrating to work with SQL Server for 20 years and run into new problems.

Setup

I want to recreate the hot page issue, so I need a table to insert into. Do I want to insert large or small rows for this test?

My first thought was to create a table with a char(8000) field, so that each row would fill a page. But surely there would be more contention with a smaller row? If many more rows fit on a page, would more threads insert into the same page, thus giving more contention?

I’m not sure which would be worse, so let’s test both.

USE PageLatch
GO
IF NOT EXISTS(
	SELECT 1 
	FROM sys.schemas ssch
	WHERE 
		ssch.name = 'Testing'
)
BEGIN
	EXEC('CREATE SCHEMA Testing');
END;
GO

IF NOT EXISTS(
	SELECT 1 FROM sys.tables st
	WHERE
		st.name = 'InsertContention_8k'
)
BEGIN
	CREATE TABLE Testing.InsertContention_8k
	(
		InsertID bigint IDENTITY(1,1) PRIMARY KEY,
		TransactionCode CHAR(8000) NOT NULL,
		InsertDateGMT DATETIME NOT NULL,
		Price money NOT NULL,
		Quantity int NOT NULL
	);
END;
GO

IF NOT EXISTS(
	SELECT 1 FROM sys.tables st
	WHERE
		st.name = 'InsertContention_100'
)
BEGIN
	CREATE TABLE Testing.InsertContention_100
	(
		InsertID bigint IDENTITY(1,1) PRIMARY KEY,
		TransactionCode VARCHAR(100) NOT NULL,
		InsertDateGMT DATETIME NOT NULL,
		Price money NOT NULL,
		Quantity int NOT NULL
	);
END;
GO

And we need a simple procedure to insert into each.

CREATE OR ALTER PROCEDURE Testing.InsertContention_8k_SingleInsert
	@TransactionCode nvarchar(20),
	@InsertDateGMT datetime2(2),
	@Price money,
	@Quantity int
	WITH EXECUTE AS OWNER
AS
BEGIN
	SET NOCOUNT ON;
	SET XACT_ABORT ON;

	INSERT Testing.InsertContention_8k
		(TransactionCode, InsertDateGMT, Price, Quantity)
	VALUES
		(@TransactionCode, @InsertDateGMT, @Price, @Quantity);
	RETURN 0;
END;
GO

CREATE OR ALTER PROCEDURE Testing.InsertContention_100_SingleInsert
	@TransactionCode nvarchar(20),
	@InsertDateGMT datetime2(2),
	@Price money,
	@Quantity int
	WITH EXECUTE AS OWNER
AS
BEGIN
	SET NOCOUNT ON;
	SET XACT_ABORT ON;

	INSERT Testing.InsertContention_100
		(TransactionCode, InsertDateGMT, Price, Quantity)
	VALUES
		(@TransactionCode, @InsertDateGMT, @Price, @Quantity);
END;
GO

Originally, I wrote a wrapper procedure to generate random data when called, then call these insert procedures with the payload. I wanted to keep the INSERT as simple as possible, so I didn’t want the data generation to be part of that statement.

After testing with this, I didn’t see as much PAGELATCH contention as I expected. This made me wonder if generating fake data with RAND() and NEWID() calls was too much of the process. The more time I spend generating data, the fewer threads are trying to insert at any given time.

Instead, I wrote a call to insert hard-coded data. Every row is the same, but that should allow us to insert faster.

Unexpected Results

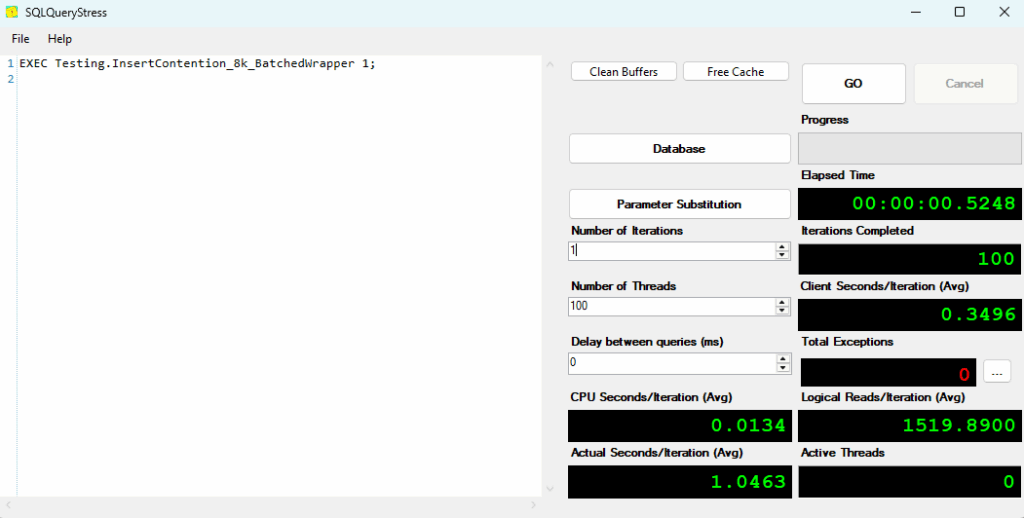
I set up to insert 1000 iterations across 100 threads using SQLQueryStress.

I noticed two things right away. The inserts into the table with a CHAR(8000) field took more than 3 times as long.

Second, there were fewer page latch waits than I expected. The larger table took 41.3 seconds to insert 100,000 rows, and page latch waits accounted for 14.6 seconds of that time. The smaller table took 12.76 seconds to insert with only 185 milliseconds of waits. The first isn’t a lot of waits given the number of threads, but the second is minuscule.

I also know that the second insert took 61 seconds from SQLQueryStress’s point of view. How did Query Store only see it run for less than 13 seconds?

What is going on here?

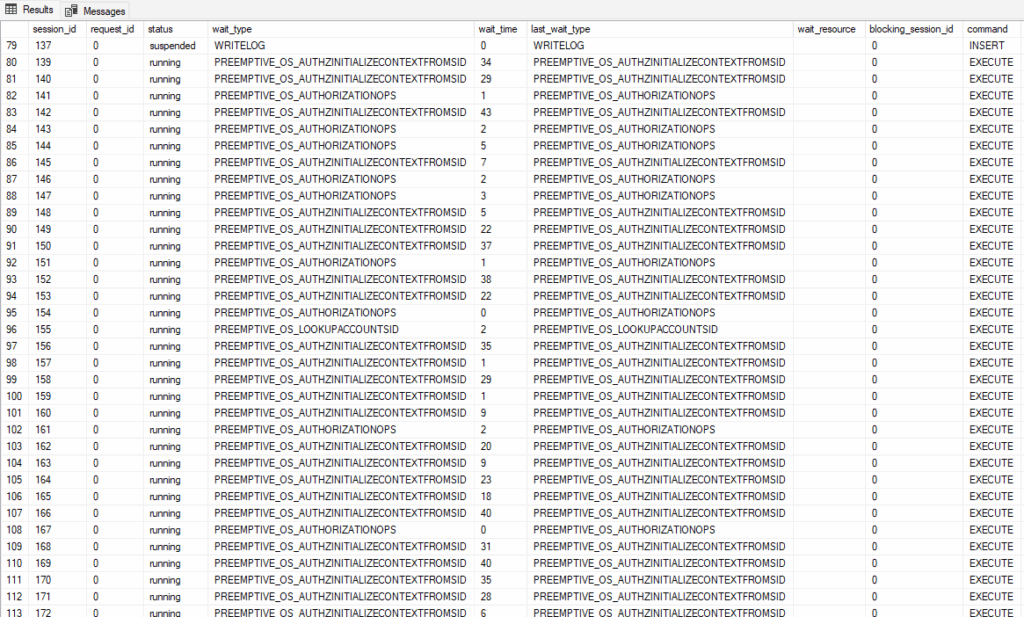
I reran the test and checked the activity in sys.dm_exec_requests after it started. I wanted to see the state of all these threads coming from SQLQueryStress.

A flood of PREEMPTIVE_OS_AUTHORIZATIONOPS and PREEMPTIVE_OS_AUTHZINITIALIZECONTEXTFROMSID waits.

Never seen that before. We are making calls to the operating system to verify our login’s permissions, but why?

A little research turned up an answer I wanted to share. I found this excellent blog post by Andreas Wolter.

The issue is caused by two things: the database is owned by a local Windows account (my login), and the procedure is the WITH EXECUTE AS OWNER option. Windows is being called to validate the account this is running under, and Andreas found it was much slower for a local account than a domain account.

The solution in my case was to change the dbowner to sa.

ALTER AUTHORIZATION ON DATABASE::PageLatch to sa;

Alternatively, I could have removed WITH EXECUTE AS OWNER from the procedures.

Better Results

When I ran the test again, things were much different.

The inserts into the smaller table now took 639 seconds instead of 12.76! PAGELATCH waits took 447 seconds, and other LATCH waits were most of the remainder.

It was also very noticeable that running this test from SQLQueryStress took 9.7 seconds instead of 61 seconds from the first test. There’s far less overhead and delay from all of the calls to authenticate the user.

But why is the difference so high in Query Store’s numbers? The second test allows the threads to start running the query faster, so more threads are trying to insert at once. When each thread pauses to wait for the page latch it needs, that wait counts as part of its duration.

In the first test, the preemptive call would have happened when we were authenticating and was not part of the query itself. The authentication delay caused us to insert 100,000 rows over a much longer period of real time (9.7 s vs 61s), so there was less concurrency and fewer page latch waits.

Comparison

The inserts into the table with the CHAR(8000) field took longer, 1082 seconds compared with 639 seconds, with 730 seconds of page latch waits. I had wondered if the larger field would result in less contention. If each row will take up an entire page, then the separate connections should be requesting different pages.

The results refute that. It seems that each connection was still waiting for the previous INSERT, as if it would insert into the same page.

The active process would have waited for the new page to be allocated. That page allocation delay should be a different wait type (likely LATCH_xx), but all the other processes waiting on the first would still be waiting on PAGELATCH.

The need to allocate a page would increase PAGELATCH waits indirectly for the secondary threads. Any delay affecting the active process would have a similar effect.

Of course, the table with the larger field had more ‘Buffer IO’ waits (which would include PAGEIOLATCH, WRITELOG, and anything else disk-oriented). For both processes, the PAGELATCH waits were much larger (1000x or more).

Temporal Anomaly

How did the queries take so much longer in Query Store than reported by SQLQueryStress?

The system has an 8-core CPU, hyperthreaded, so SQL Server sees 16 cores and has 16 schedulers. Only one thread can be running per scheduler at any given time, but I had SQLQueryStress running this across 100 threads at a time.

Each scheduler will have 6 or so connections trying to run the insert. Whether each thread is running or waiting, the duration is still increasing. The total duration of the query could increase by up to 100 seconds per second of real time.

Similarly, you may see queries with higher CPU time than duration. This is typically because the query has gone parallel. The CPU time would include the time used for all threads, so it can increase by a multiple of real-time. The duration would still measure the real-time duration of the query as a whole.

Setup Complete

Now that we are getting reasonable results with most of our waits being PAGELATCH_XX, I will follow up with a second post testing out multiple solutions. I’ll use several aproaches and include numbers for each.

My social media links are above. Please contact me if you have questions, and I would be happy to consult with you if you have a more complex performance issue. Also, let me know if you have any suggestions for a topic for a new blog post.

Query Store is my favorite way to gather information about problem queries and plans, and I wanted to share some information on the useful metrics I use most.

The first two are obvious, but there’s a difference between them. The last two are not obvious but offer an unusual utility. I also wanted to explain why I use logical reads and mostly ignore physical reads.

CPU and Duration

Most tools and scripts are going to focus on queries’ CPU and duration, and they certainly should. I mention them to point out one important difference.

The CPU required for a given query depends on many factors: the operations in the plans, the physical reads generated, parallelism, etc. But this should be mostly consistent for the same query and plan with the same parameters as inputs.

Duration can vary more wildly. This could be driven by blocking, system load, resource contention, or other waits. The circumstances for these can vary wildly and will depend more on the current state of the server and the other queries running.

We should consider the duration of the query we are monitoring and measure the improvements we make while tuning it based on its duration. But duration isn’t a good measure of the amount of work a query is doing. There are many factors that can inflate a query’s duration by preventing the query from operating.

A high-duration query could just be a victim; the culprit could be the query blocking it or causing a resource issue. A high CPU query is actively doing more work than a query with less CPU.

Logical Reads

I’ve written about logical reads before and have long felt they are a sneaky good metric for performance.

If you have CPU-intensive queries or queries generating a lot of physical reads, they tend to be obvious. You can see the effects of either in Task Manager, much less any SQL Server specific tool. A quick check of your waits will make the nature of your problem obvious.

Logical reads don’t show up in the same way. If you are reading a large number of pages that are already in memory, it won’t tax your CPU or cause your disks to spike. There can be a large amount of work going on, but it’s not obvious where the work is taking place. And while logical reads are faster than getting data from spinning disks, that doesn’t mean it is instantaneous.

The second point about logical reads that makes them a good metric is that they are a consistent indicator of actual work. A given plan against the same source with the same parameters should read a similar number of pages. So you can compare two plans or queries just based on this metric; the query with more logical reads does more work.

Physical reads are more random; whether a query generates a lot of physical reads depends on what is in the cache at the moment. Running the same query again moments later may result in no physical reads. A truly huge query (or inefficient plan) could require more data than would fit into the cache, which would force more physical reads. That would generate physical reads more consistently than a smaller query.

If I’m going to look for queries that I may want to tune, I’ll look for my top queries by logical reads, not physical reads.

Execution Count

This is another sneaky good metric. It gives insights into the patterns in our applications and can lead to interesting conversations with developers.

Let’s say in Query Store, you see that a given plan is executed 1 million times a day. Is that a lot for the application? It could be hard to say. But if you consider that’s more than 11 executions per second all day, that sounds more significant.

Does that seem to match the pace of our application and the number of users in that database? It’s not obvious where to draw the line.

When I see oddities from the execution count, I may well ask the application developers, “Should this query be running 11 times a second all day?” Sometimes the dev can give you a firm no. That leads to a very different path to improve our database performance; we may do nothing while the application developers update behavior on their end. Or maybe we both make changes.

The execution count gives us insight into the behavior of our applications, which can be invaluable.

Rowcount

Not at all the same as the other metrics, but I’ve found a use for this metric recently that I wanted to share.

Imagine you are tuning a complex stored procedure. You start by finding the statement with the highest duration or CPU. The query joins several tables, and you can see which indexes are used by the plan.

You can review the statistics for the indexes to see how many rows you expect a given operation to return. That may be more accurate than the numbers in an estimated plan.

But what if there is a temp table in your query? There are no statistics to look at. You can’t be sure how many rows to expect from the temp table unless you are very familiar with the process. It could depend highly on the inputs to the procedure, and it could be key to how the query performs.

We can get that answer by finding the query that populates the temp table and checking its avg_rowcount in sys.query_store_runtime_stats. It might be wise to check min_rowcount and max_rowcount as well, to see how much variance there is.

This information gives useful context for the original query. It may help explain why one plan outperforms another, or suggest a different join order for the query.

An odd case

All of these metrics are useful, but sometimes we need more than one to see the whole picture.

A few years ago, I was reviewing an unfamiliar server with a high CPU. I used CPU as my first metric and found the top query. It wasn’t a bad plan (it was simple enough to be hard to improve), but the pattern was very odd. The query was executed several thousand times per hour during the day, but tens of thousands of times per hour at night.

That disparity in execution count was odd, and it was obvious in Database Performance Analyzer (and no, this blog isn’t sponsored, but the hourly graphs made it very obvious). Why would it behave this way? Is this database being used by customers in APAC?

I said at one point it was almost like this query was being called from a hard loop in the application; if the server was less active at night, there would be more resources to run the query.

That turns out to have been the exact cause. The loop in question should have had a time delay, but that delay was set to 0 milliseconds. The biggest clue in this case was the change to the execution count over time.

A quick sample

Here’s an example query including all of these fields. It’s aggregated and includes a few suggested filters.

SELECT 
	qsq.query_id,
	qsp.plan_id,
	SUM(rs.count_executions) as count_executions,
	SUM(rs.avg_duration * rs.count_executions) as total_duration,
	SUM(rs.avg_duration * rs.count_executions) / SUM(rs.count_executions) as avg_duration,
	SUM(rs.avg_cpu_time * rs.count_executions) as total_cpu_time,
	SUM(rs.avg_cpu_time * rs.count_executions) / SUM(rs.count_executions) as avg_cpu_time,
	SUM(rs.avg_logical_io_reads * rs.count_executions) as total_logical_io_reads,
	SUM(rs.avg_logical_io_reads * rs.count_executions) / SUM(rs.count_executions) as avg_logical_io_reads,
	SUM(rs.avg_rowcount * rs.count_executions) as total_rowcount,
	SUM(rs.avg_rowcount * rs.count_executions) / SUM(rs.count_executions) as avg_rowcount,
	qt.query_sql_text,
	CAST(qsp.query_plan as XML) AS query_plan
FROM sys.query_store_query qsq
INNER JOIN sys.query_store_plan qsp
	ON qsp.query_id = qsq.query_id
INNER JOIN sys.query_store_query_text qt
	ON qt.query_text_id = qsq.query_text_id
INNER JOIN sys.query_store_runtime_stats rs
	ON rs.plan_id = qsp.plan_id
WHERE
	rs.last_execution_time > DATEADD(DAY,-2, GETUTCDATE())
	--AND qsq.object_id = OBJECT_ID('dbo.User_GetByReputation')
	--AND qt.query_sql_text like '%%'
GROUP BY
	qsq.query_id,
	qsp.plan_id,
	qsp.query_plan,
	qt.query_sql_text

This is a good general Query Store query I’d use when reviewing a specific procedure or query. I can always modify from this if I need something specific.

Summary on Useful Metrics

I tend not to use the UI for Query Store often. I’d rather write queries to look at the details myself. I only recently saw the value of the rowcount field; that’s the main reason I wanted to write this blog.

There’s always more to learn.

You can follow me on Bluesky (@sqljared) and contact me if you have questions. My other social media links are at the top of the page. Also, let me know if you have any suggestions for a topic for a new blog post.

Estimates and statistics are often discussed in our community, but I doubt the average DBA knows how they flow. So I wanted to write a post with examples showing how SQL Server estimates the rows for a specific operation.

Statistics

The SQL Server optimizer will estimate how many rows it expects to return for a query using statistics. This is part of how it determines the cost of plans and decides which plan to use.

Let’s take a look at the statistics for the Sales.Order table in the WideWorldImporters database. There is an index on the CustomerID column, so we’ll look at the statistics for that object.

DBCC SHOW_STATISTICS('Sales.Orders', FK_Sales_Orders_CustomerID);

Here’s most of the result from the DBCC command:

You can also get the same information by double-clicking the statistic in SSMS, and going to Detail on the popup:

Let’s look at the most important elements.

  • Updated: Very important. How often you should update statistics depends on several factors, but it’s good to know how old your statistics are when troubleshooting a bad plan. This date is from 2016 if you’ve just restored the WideWorldImporters database, but I just rebuilt that index (which updates the stats with a 100% sampling rate for free).
  • Rows and Rows Sampled: How many rows are in the index, and how many were sampled for the statistic object. This is a 100% sampling rate, but when stats are updated automatically this number can easily be less than 1%. The lower the sampling rate, the less accurate the statistics will be. This can lead to bad decisions by the optimizer. I prefer a higher rate, but we have to decide how long we want this to take on a large table.
  • Steps: Each step contains information about a range of key values for the index. Each step is defined by the last range value included. The final output shows each step as a row. 200 is the maximum number of steps.
  • All Density: This number is the inversion of the number of unique values for this column (1/distinct values). If the key has multiple columns, this will have multiple rows, and you can see how much more selective the index is when the additional columns are included. The value of 0.001508296 corresponds to 663 unique CustomerID values in the index. There are multiple rows in the second result set because this index has multiple columns. The All Density value gives the uniqueness for each combination of columns.

The third result set is a bit more involved, so I wanted to discuss how we can use it.

Histogram

  • RANGE_HI_KEY: Indicates the highest value for this range of values, as each row represents a step I referenced earlier. There is a row with a RANGE_HI_KEY of 3, and the next row is 6. This means CustomerID 4 and 5 are in the same step as 6, which is the RANGE_HI_KEY.
  • RANGE_ROWS: Gives the number of rows for all values of this step\range, excluding the RANGE_HI_KEY.
  • EQ_ROWS: Gives the number of rows equal to the RANGE_HI_KEY.
  • DISTINCT_RANGE_ROWS: This gives how many distinct values there are in the RANGE_ROWS, excluding the RANGE_HI_KEY again.
  • AVG_RANGE_ROWS: How many values are there for a key value in this range, on average.

Looking at the third row where the RANGE_HI_KEY is 6, the EQ_ROWS are 106. So if we query for CustomerID = 6, this histogram tells us we should return 106 rows.

The DISTINCT_RANGE_ROWS is 2, so there is only one more CustomerID in this range (either 4 or 5). RANGE_ROWS is 214, so the other CustomerID should have 108 rows, but if there are more than 2 distinct values we won’t know any number besides the EQ_ROWS. So if we look up a range value that isn’t the RANGE_HI_KEY, we’ll estimate based on AVG_RANGE_ROWS.

Example #1: RANGE_HI_KEY

To see how these numbers are used, let’s look at a simple query against the Sales.Orders table.

--RANGE_HI_KEY and EQ_ROWS
SELECT 
	OrderID
FROM Sales.Orders so
WHERE
	so.CustomerID = 99;
GO

Since 99 is the RANGE_HI_KEY for its step, we just need to check the EQ_ROWS. This query should return 122 rows. Since 99 is the RANGE_HI_KEY for its step, we just need to check the EQ_ROWS. This query should return 122 rows.

So let’s look at the plan to confirm.

That’s the estimate the plan displays, and it’s accurate because I just updated my stats.

Example #2: AVG_RANGE_ROWS

Slightly different if we search for a value that is not the RANGE_HI_KEY for its step.

--RANGE_HI_KEY and AVG_RANGE_ROWS
SELECT 
	OrderID
FROM Sales.Orders so
WHERE
	so.CustomerID = 98;
GO

Each step is defined by its highest value. So if there is a step for 96 and 99, 98 is in the same step as 99. We don’t know the number of rows for any row in the step except for the RANGE_HI_KEY, so the estimate should be the value stored in AVG_RANGE_ROWS, 125.5.

The operator indicates an estimate of 126, but if we hover over it we can see the exact value of 125.5. We returned 127 rows. There are limitations here, but this is a pretty close estimate.

Exampled #3: Variables

We see a different behavior if we use a variable in the query.

--Variable Estimate
DECLARE @CustomerID INT = 99;

SELECT 
	OrderID
FROM Sales.Orders so
WHERE
	so.CustomerID = @CustomerID;
GO

The estimate is off. When we had the value inline, the optimizer “sniffed” that value to see how many rows to expect. It didn’t do the same for the local variable.

Since the optimizer doesn’t know what the value inside that variable is, it can’t use the histogram. It has to make an estimate based on the details at the table level instead of the step level.

I mentioned the All Density value earlier. It’s a measure of how unique a given column is. If you multiply that value by the number of rows in the table, you should get an average number of rows that would be returned for a given CustomerID.

--Calculated Estimate
DECLARE
	@density numeric(12,12) = 0.009183228,
	@all_density numeric (12,12) = 0.001508296,
	@rows int = 73595.

SELECT
	1.0/@all_density AS Distinct_CustomerID,
	@all_density * @rows AS Estimated_Rows;
GO

This matches the value of 111.003 from the execution plan. So this is a somewhat blind estimate for any CustomerID when the optimizer doesn’t know the value before compiling.

Sidenote on Example #3:

This didn’t calculate correctly for me at first. It caused much consternation as I did more reading to try to understand why the numbers didn’t match. I likely would have posted this blog some time ago without this issue.

Then I realized WideWorldImporters was created for SQL Server 2016. These statistics were created in SQL Server 2016, and were restored with the rest of the database on my instance of SQL Server 2022.

Maybe I should rebuild the index? Then I did. And now it works perfectly.

Something to keep in mind for your endeavors.

Exampled #4: RECOMPILE

If we add OPTION(RECOMPILE) to our query, the optimizer will sniff the local variable and

--Recompile to Sniff Local Variable
DECLARE @CustomerID INT = 99;

SELECT 
	OrderID
FROM Sales.Orders so
WHERE
	so.CustomerID = @CustomerID
OPTION(RECOMPILE);
GO

And now our estimate is accurate again. It’s good to understand this point because you may see a large difference if you use OPTION(RECOMPILE) with a query that depends on a local variable.

Range Estimates

With range seeks (inequality comparisons), things are a bit different. We’re not looking for a specific value, and we’ll use our statistics differently. And there is one issue I’d like to point out. Consider this query:

SELECT so.OrderID
FROM Sales.Orders so
WHERE
	so.CustomerID >= 1001;
GO

When I execute this, the estimate is very accurate.

We’re only off by 1 row, and I will happily accept. But how did the optimizer arrive here? Let’s look at the last group of steps in this statistic.

The RANGE_ROWS is useful to use here for this range seek. It will tell the optimizer how many rows to expect from each step, but it excludes the EQ_ROWS, which is the number of rows for the RANGE_HI_KEY itself. So, to estimate this we will need to include the EQ_ROWS and RANGE_ROWS for each of these steps. If you add the highlighted numbers, you’ll end up with 4204.

Of course, the query would exclude CustomerID 1000, which should be in the step for CustomerID 1003. We don’t the exact value for this CustomerID; it’s one of our range values. So our best estimate is the AVG_RANGE_ROWS for that step, 121. If we subtract the 121 rows we estimate for CustomerID 1000, we have a final estimate of 4083.

Inequalities and Variables

But what if you used a variable with that same query?

DECLARE @CustomerID INT = 1001;

SELECT so.OrderID
FROM Sales.Orders so
WHERE
	so.CustomerID >= @CustomerID;
GO

The estimate is off by 82%. What just happened?

The optimizer can’t probe the variable, so it has nothing to base its estimate on. This estimate of 22078 is a default the optimizer uses guessing our query will return 30% of the rows in the table. This is present in the legacy cardinality estimator and the current CE for SQL Server 2022.

The first time I heard of this estimate was at a talk at PASS Summit. There are some references to it on other blogs, but there aren’t many of them.

These two blogs by Erik Darling and Andrew Pruski refer to the 30% estimate, and if you are reading this blog you might find them enlightening.

This blog by @sqlscotsman has more details about estimates and guesses involving other operators including LIKEs and BETWEENs.

In a more complex query where the range seek isn’t the only option to filter on, SQL Server can use other fields to make a more accurate estimate.

In Summary

Why does accuracy matter? When estimates are inaccurate, SQL Server will compare plans with incorrect costs. We’re more likely to end up with bad plans that over\under allocate resources or use the wrong join type or join order for a query.

The wrong plan can multiply the runtime of a query many times and massive increase blocking issues.

Knowing how our statistics function can help us write better procedures that are less likely to leave the optimizer in the dark.

My social media links are above. Please contact me if you have questions, and I’m happy to consult with you if you have a more complex performance issue. Also, let me know if you have any suggestions for a topic for a new blog post.