I’ve already posted a blog on page latch waits and some of the ways to minimize them, but I wanted to add some more on the issue. I wanted to test out some strategies to see how effective they are.
Setting up tests can be very difficult in some cases, and this attempt encountered a very unusual problem. At the risk of delaying the intended results, I wanted to point this out. It’s both interesting and frustrating to work with SQL Server for 20 years and run into new problems.
Setup
I want to recreate the hot page issue, so I need a table to insert into. Do I want to insert large or small rows for this test?
My first thought was to create a table with a char(8000) field, so that each row would fill a page. But surely there would be more contention with a smaller row? If many more rows fit on a page, would more threads insert into the same page, thus giving more contention?
I’m not sure which would be worse, so let’s test both.
USE PageLatch
GO
IF NOT EXISTS(
	SELECT 1
	FROM sys.schemas ssch
	WHERE
		ssch.name = 'Testing'
)
BEGIN
	EXEC('CREATE SCHEMA Testing');
END;
GO

IF NOT EXISTS(
	SELECT 1 FROM sys.tables st
	WHERE
		st.name = 'InsertContention_8k'
)
BEGIN
	CREATE TABLE Testing.InsertContention_8k
	(
		InsertID bigint IDENTITY(1,1) PRIMARY KEY,
		TransactionCode CHAR(8000) NOT NULL,
		InsertDateGMT DATETIME NOT NULL,
		Price money NOT NULL,
		Quantity int NOT NULL
	);
END;
GO

IF NOT EXISTS(
	SELECT 1 FROM sys.tables st
	WHERE
		st.name = 'InsertContention_100'
)
BEGIN
	CREATE TABLE Testing.InsertContention_100
	(
		InsertID bigint IDENTITY(1,1) PRIMARY KEY,
		TransactionCode VARCHAR(100) NOT NULL,
		InsertDateGMT DATETIME NOT NULL,
		Price money NOT NULL,
		Quantity int NOT NULL
	);
END;
GO
And we need a simple procedure to insert into each.
CREATE OR ALTER PROCEDURE Testing.InsertContention_8k_SingleInsert
	@TransactionCode nvarchar(20),
	@InsertDateGMT datetime2(2),
	@Price money,
	@Quantity int
	WITH EXECUTE AS OWNER
AS
BEGIN
	SET NOCOUNT ON;
	SET XACT_ABORT ON;

	INSERT Testing.InsertContention_8k
		(TransactionCode, InsertDateGMT, Price, Quantity)
	VALUES
		(@TransactionCode, @InsertDateGMT, @Price, @Quantity);
	RETURN 0;
END;
GO

CREATE OR ALTER PROCEDURE Testing.InsertContention_100_SingleInsert
	@TransactionCode nvarchar(20),
	@InsertDateGMT datetime2(2),
	@Price money,
	@Quantity int
	WITH EXECUTE AS OWNER
AS
BEGIN
	SET NOCOUNT ON;
	SET XACT_ABORT ON;

	INSERT Testing.InsertContention_100
		(TransactionCode, InsertDateGMT, Price, Quantity)
	VALUES
		(@TransactionCode, @InsertDateGMT, @Price, @Quantity);
END;
GO
Originally, I wrote a wrapper procedure to generate random data when called, then call these insert procedures with the payload. I wanted to keep the INSERT as simple as possible, so I didn’t want the data generation to be part of that statement.
After testing with this, I didn’t see as much PAGELATCH contention as I expected. This made me wonder if generating fake data with RAND() and NEWID() calls was too much of the process. The more time I spend generating data, the fewer threads are trying to insert at any given time.
Instead, I wrote a call to insert hard-coded data. Every row is the same, but that should allow us to insert faster.
Unexpected Results
I set up to insert 1000 iterations across 100 threads using SQLQueryStress.
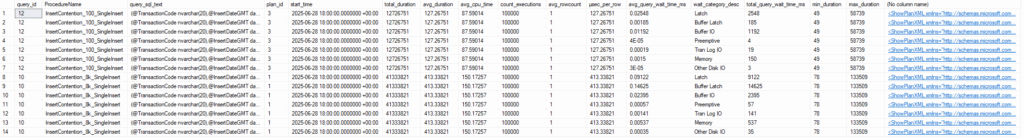
I noticed two things right away. The inserts into the table with a CHAR(8000) field took more than 3 times as long.
Second, there were fewer page latch waits than I expected. The larger table took 41.3 seconds to insert 100,000 rows, and page latch waits accounted for 14.6 seconds of that time. The smaller table took 12.76 seconds to insert with only 185 milliseconds of waits. The first isn’t a lot of waits given the number of threads, but the second is minuscule.
I also know that the second insert took 61 seconds from SQLQueryStress’s point of view. How did Query Store only see it run for less than 13 seconds?
What is going on here?
I reran the test and checked the activity in sys.dm_exec_requests after it started. I wanted to see the state of all these threads coming from SQLQueryStress.
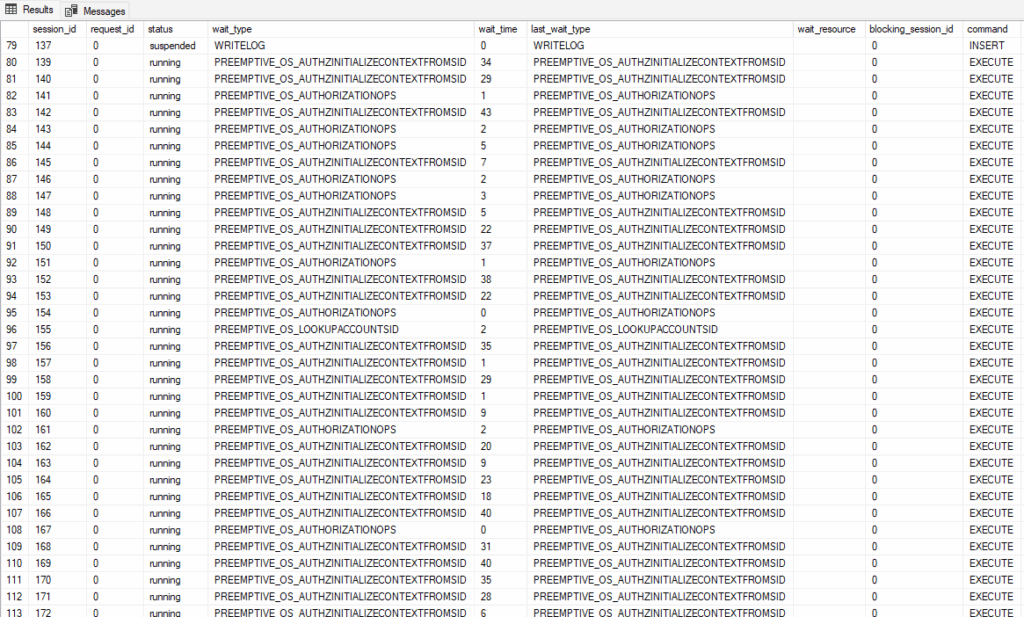
A flood of PREEMPTIVE_OS_AUTHORIZATIONOPS and PREEMPTIVE_OS_AUTHZINITIALIZECONTEXTFROMSID waits.
Never seen that before. We are making calls to the operating system to verify our login’s permissions, but why?
A little research turned up an answer I wanted to share. I found this excellent blog post by Andreas Wolter.
The issue is caused by two things: the database is owned by a local Windows account (my login), and the procedure is the WITH EXECUTE AS OWNER option. Windows is being called to validate the account this is running under, and Andreas found it was much slower for a local account than a domain account.
The solution in my case was to change the dbowner to sa.
ALTER AUTHORIZATION ON DATABASE::PageLatch to sa;
Alternatively, I could have removed WITH EXECUTE AS OWNER from the procedures.
Better Results
When I ran the test again, things were much different.
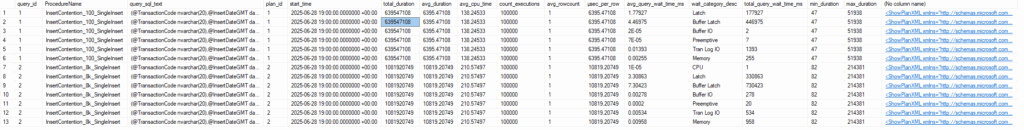
The inserts into the smaller table now took 639 seconds instead of 12.76! PAGELATCH waits took 447 seconds, and other LATCH waits were most of the remainder.
It was also very noticeable that running this test from SQLQueryStress took 9.7 seconds instead of 61 seconds from the first test. There’s far less overhead and delay from all of the calls to authenticate the user.
But why is the difference so high in Query Store’s numbers? The second test allows the threads to start running the query faster, so more threads are trying to insert at once. When each thread pauses to wait for the page latch it needs, that wait counts as part of its duration.
In the first test, the preemptive call would have happened when we were authenticating and was not part of the query itself. The authentication delay caused us to insert 100,000 rows over a much longer period of real time (9.7 s vs 61s), so there was less concurrency and fewer page latch waits.
Comparison
The inserts into the table with the CHAR(8000) field took longer, 1082 seconds compared with 639 seconds, with 730 seconds of page latch waits. I had wondered if the larger field would result in less contention. If each row will take up an entire page, then the separate connections should be requesting different pages.
The results refute that. It seems that each connection was still waiting for the previous INSERT, as if it would insert into the same page.
The active process would have waited for the new page to be allocated. That page allocation delay should be a different wait type (likely LATCH_xx), but all the other processes waiting on the first would still be waiting on PAGELATCH.
The need to allocate a page would increase PAGELATCH waits indirectly for the secondary threads. Any delay affecting the active process would have a similar effect.
Of course, the table with the larger field had more ‘Buffer IO’ waits (which would include PAGEIOLATCH, WRITELOG, and anything else disk-oriented). For both processes, the PAGELATCH waits were much larger (1000x or more).
Temporal Anomaly
How did the queries take so much longer in Query Store than reported by SQLQueryStress?
The system has an 8-core CPU, hyperthreaded, so SQL Server sees 16 cores and has 16 schedulers. Only one thread can be running per scheduler at any given time, but I had SQLQueryStress running this across 100 threads at a time.
Each scheduler will have 6 or so connections trying to run the insert. Whether each thread is running or waiting, the duration is still increasing. The total duration of the query could increase by up to 100 seconds per second of real time.
Similarly, you may see queries with higher CPU time than duration. This is typically because the query has gone parallel. The CPU time would include the time used for all threads, so it can increase by a multiple of real-time. The duration would still measure the real-time duration of the query as a whole.
Setup Complete
Now that we are getting reasonable results with most of our waits being PAGELATCH_XX, I will follow up with a second post testing out multiple solutions. I’ll use several aproaches and include numbers for each.
My social media links are above. Please contact me if you have questions, and I would be happy to consult with you if you have a more complex performance issue. Also, let me know if you have any suggestions for a topic for a new blog post.
1 thought on “Page Latch Testing”