Query Store is my favorite way to gather information about problem queries and plans, and I wanted to share some information on the useful metrics I use most.

The first two are obvious, but there’s a difference between them. The last two are not obvious but offer an unusual utility. I also wanted to explain why I use logical reads and mostly ignore physical reads.

CPU and Duration

Most tools and scripts are going to focus on queries’ CPU and duration, and they certainly should. I mention them to point out one important difference.

The CPU required for a given query depends on many factors: the operations in the plans, the physical reads generated, parallelism, etc. But this should be mostly consistent for the same query and plan with the same parameters as inputs.

Duration can vary more wildly. This could be driven by blocking, system load, resource contention, or other waits. The circumstances for these can vary wildly and will depend more on the current state of the server and the other queries running.

We should consider the duration of the query we are monitoring and measure the improvements we make while tuning it based on its duration. But duration isn’t a good measure of the amount of work a query is doing. There are many factors that can inflate a query’s duration by preventing the query from operating.

A high-duration query could just be a victim; the culprit could be the query blocking it or causing a resource issue. A high CPU query is actively doing more work than a query with less CPU.

Logical Reads

I’ve written about logical reads before and have long felt they are a sneaky good metric for performance.

If you have CPU-intensive queries or queries generating a lot of physical reads, they tend to be obvious. You can see the effects of either in Task Manager, much less any SQL Server specific tool. A quick check of your waits will make the nature of your problem obvious.

Logical reads don’t show up in the same way. If you are reading a large number of pages that are already in memory, it won’t tax your CPU or cause your disks to spike. There can be a large amount of work going on, but it’s not obvious where the work is taking place. And while logical reads are faster than getting data from spinning disks, that doesn’t mean it is instantaneous.

The second point about logical reads that makes them a good metric is that they are a consistent indicator of actual work. A given plan against the same source with the same parameters should read a similar number of pages. So you can compare two plans or queries just based on this metric; the query with more logical reads does more work.

Physical reads are more random; whether a query generates a lot of physical reads depends on what is in the cache at the moment. Running the same query again moments later may result in no physical reads. A truly huge query (or inefficient plan) could require more data than would fit into the cache, which would force more physical reads. That would generate physical reads more consistently than a smaller query.

If I’m going to look for queries that I may want to tune, I’ll look for my top queries by logical reads, not physical reads.

Execution Count

This is another sneaky good metric. It gives insights into the patterns in our applications and can lead to interesting conversations with developers.

Let’s say in Query Store, you see that a given plan is executed 1 million times a day. Is that a lot for the application? It could be hard to say. But if you consider that’s more than 11 executions per second all day, that sounds more significant.

Does that seem to match the pace of our application and the number of users in that database? It’s not obvious where to draw the line.

When I see oddities from the execution count, I may well ask the application developers, “Should this query be running 11 times a second all day?” Sometimes the dev can give you a firm no. That leads to a very different path to improve our database performance; we may do nothing while the application developers update behavior on their end. Or maybe we both make changes.

The execution count gives us insight into the behavior of our applications, which can be invaluable.

Rowcount

Not at all the same as the other metrics, but I’ve found a use for this metric recently that I wanted to share.

Imagine you are tuning a complex stored procedure. You start by finding the statement with the highest duration or CPU. The query joins several tables, and you can see which indexes are used by the plan.

You can review the statistics for the indexes to see how many rows you expect a given operation to return. That may be more accurate than the numbers in an estimated plan.

But what if there is a temp table in your query? There are no statistics to look at. You can’t be sure how many rows to expect from the temp table unless you are very familiar with the process. It could depend highly on the inputs to the procedure, and it could be key to how the query performs.

We can get that answer by finding the query that populates the temp table and checking its avg_rowcount in sys.query_store_runtime_stats. It might be wise to check min_rowcount and max_rowcount as well, to see how much variance there is.

This information gives useful context for the original query. It may help explain why one plan outperforms another, or suggest a different join order for the query.

An odd case

All of these metrics are useful, but sometimes we need more than one to see the whole picture.

A few years ago, I was reviewing an unfamiliar server with a high CPU. I used CPU as my first metric and found the top query. It wasn’t a bad plan (it was simple enough to be hard to improve), but the pattern was very odd. The query was executed several thousand times per hour during the day, but tens of thousands of times per hour at night.

That disparity in execution count was odd, and it was obvious in Database Performance Analyzer (and no, this blog isn’t sponsored, but the hourly graphs made it very obvious). Why would it behave this way? Is this database being used by customers in APAC?

I said at one point it was almost like this query was being called from a hard loop in the application; if the server was less active at night, there would be more resources to run the query.

That turns out to have been the exact cause. The loop in question should have had a time delay, but that delay was set to 0 milliseconds. The biggest clue in this case was the change to the execution count over time.

A quick sample

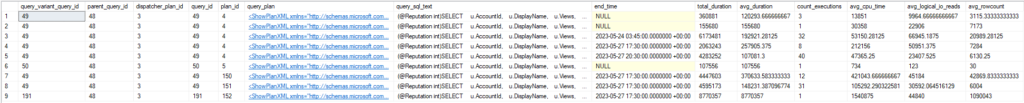
Here’s an example query including all of these fields. It’s aggregated and includes a few suggested filters.

SELECT 
	qsq.query_id,
	qsp.plan_id,
	SUM(rs.count_executions) as count_executions,
	SUM(rs.avg_duration * rs.count_executions) as total_duration,
	SUM(rs.avg_duration * rs.count_executions) / SUM(rs.count_executions) as avg_duration,
	SUM(rs.avg_cpu_time * rs.count_executions) as total_cpu_time,
	SUM(rs.avg_cpu_time * rs.count_executions) / SUM(rs.count_executions) as avg_cpu_time,
	SUM(rs.avg_logical_io_reads * rs.count_executions) as total_logical_io_reads,
	SUM(rs.avg_logical_io_reads * rs.count_executions) / SUM(rs.count_executions) as avg_logical_io_reads,
	SUM(rs.avg_rowcount * rs.count_executions) as total_rowcount,
	SUM(rs.avg_rowcount * rs.count_executions) / SUM(rs.count_executions) as avg_rowcount,
	qt.query_sql_text,
	CAST(qsp.query_plan as XML) AS query_plan
FROM sys.query_store_query qsq
INNER JOIN sys.query_store_plan qsp
	ON qsp.query_id = qsq.query_id
INNER JOIN sys.query_store_query_text qt
	ON qt.query_text_id = qsq.query_text_id
INNER JOIN sys.query_store_runtime_stats rs
	ON rs.plan_id = qsp.plan_id
WHERE
	rs.last_execution_time > DATEADD(DAY,-2, GETUTCDATE())
	--AND qsq.object_id = OBJECT_ID('dbo.User_GetByReputation')
	--AND qt.query_sql_text like '%%'
GROUP BY
	qsq.query_id,
	qsp.plan_id,
	qsp.query_plan,
	qt.query_sql_text

This is a good general Query Store query I’d use when reviewing a specific procedure or query. I can always modify from this if I need something specific.

Summary on Useful Metrics

I tend not to use the UI for Query Store often. I’d rather write queries to look at the details myself. I only recently saw the value of the rowcount field; that’s the main reason I wanted to write this blog.

There’s always more to learn.

You can follow me on Bluesky (@sqljared) and contact me if you have questions. My other social media links are at the top of the page. Also, let me know if you have any suggestions for a topic for a new blog post.

I’ve learned a few more items of interest relating to Parameter Sensitive Plan Optimization that I wanted to pass on.

Parameter Sensitive Plan Optimization: Known issue resolved

First, I wanted to point out that there are fixes to issues specific to Parameter Sensitive Plan Optimization in SQL Server 2022. The issue itself is documented at the link below.

https://learn.microsoft.com/en-us/sql/relational-databases/performance/parameter-sensitive-plan-optimization?view=sql-server-ver16#known-issues

When I heard about the issue, I heard that it could cause SQL Server 2022 to cause stack dumps every 15 minutes. The time interval made me think it was related to the default interval for Query Store, and that seems to be the case.

There’s only one known issue documented, but there appear to be updates in CU5 and CU6 for this issue (or some variation of this issue). I’ll link to both below:

https://learn.microsoft.com/en-us/troubleshoot/sql/releases/sqlserver-2022/cumulativeupdate5#2357623

https://learn.microsoft.com/en-us/troubleshoot/sql/releases/sqlserver-2022/cumulativeupdate6#2470755

If you are using PSPO but not encountering this issue, that’s great. But I’d still update as soon as I can.

Don’t be a statistic

I was looking back at a previous blog post and trying to decide why I had not seen PSPO used when I tried testing using the WideWorldImporters database. I had deliberately skewed the data on the Sales.Orders table, and I tried running a procedure with different parameter values that should return a range of row counts.

Nothing.

But the point of PSPO is to take the variable passed in, determine how many rows we should expect it to return, then choose the correct plan based on that cardinality. So, its function depends on checking the histogram for that parameter.

And I hadn’t updated my statistics after I skewed the data…

It worked much better after I updated the stats.

Just thought I would drop that off to save someone else some time.

Odd relationship

With that resolved, I ran a query to see my plans for this procedure. It has only one statement, but I wanted to see the base query, any variants, and their plans. Here’s the query:

SELECT 
	qsq.query_id,
	qsp.plan_id,
	qsq.query_text_id,
	qsp.plan_type,
	qsp.plan_type_desc,
	OBJECT_NAME(qsq.object_id),
	qv.query_id,
	qvp.plan_id,
	CAST(qvp.query_plan AS XML),
	qv.query_text_id,
	qvp.plan_type,
	qvp.plan_type_desc
FROM sys.query_store_query qsq
INNER JOIN sys.query_store_plan qsp
	ON qsp.query_id = qsq.query_id
LEFT JOIN sys.query_store_query_variant vr
	ON vr.parent_query_id = qsq.query_id
LEFT JOIN sys.query_store_query qv
	ON qv.query_id = vr.query_variant_query_id
LEFT JOIN sys.query_store_plan qvp
	ON qvp.query_id = qv.query_id
WHERE
	qsq.object_id = OBJECT_ID('Sales.GetOrders')
ORDER BY
	qsq.query_id,
	qsp.plan_id,
	qv.query_id,
	qvp.plan_id;

Here are the results and they were a little surprising.

The parent query is the first column, with the dispatcher plan next.

It’s probably not immediately obvious what is odd here. The plan_type and plan_type_desc are included in the result set in columns 4 and 5 for the parent query. The first 12 rows show “Compiled Plan” as its type, but that’s the type for a “normal” query that isn’t using PSPO. So why are all the variant columns populated?

Because the query_id didn’t change once we started using a new dispatcher plan. Since we only joined to sys.query_store_query_variant based on the parent_query_id, we related our variant queries to all plans for the parent_query_id.

Joining on the dispatcher_plan_id as well seems appropriate.

LEFT JOIN sys.query_store_query_variant vr
	ON vr.parent_query_id = qsq.query_id
	AND vr.dispatcher_plan_id = qsp.plan_id

Yeah, that’s a lot better.

Multiple variables?

A skewed parameter will return a low (less than 100 rows), middle, or high (either more than 100,000 rows or more than 1 million) number of rows. When the optimizer sees the value of the parameter passed in, it gets the cardinality of that value to decide which plan to use.

But SQL Server can vary depending on up to three different parameters for a query. Each parameter has its low, middle, and high thresholds, and plans are created for the various combinations of those parameters.

I recently saw an example of a query using PSPO with multiple parameters. Here’s the dispatcher block of the XML from the anonymized plan for that query:

          <Dispatcher>
            <ParameterSensitivePredicate LowBoundary="100" HighBoundary="100000">
              <StatisticsInfo LastUpdate="2023-02-09T03:47:24.27" ModificationCount="26303" SamplingPercent="86.3454" Statistics="[_statistic_1]" Table="Object1" Schema="Schema1" Database="Database1" />
              <Predicate>
                <ScalarOperator ScalarString="ScalarString1">
                  <Compare CompareOp="EQ">
                    <ScalarOperator>
                      <Identifier>
                        <ColumnReference Database="Database1" Schema="Schema1" Table="Object1" Alias="Object3" Column="Column1" />
                      </Identifier>
                    </ScalarOperator>
                    <ScalarOperator>
                      <Identifier>
                        <ColumnReference Column="Column2" />
                      </Identifier>
                    </ScalarOperator>
                  </Compare>
                </ScalarOperator>
              </Predicate>
            </ParameterSensitivePredicate>
            <ParameterSensitivePredicate LowBoundary="100" HighBoundary="100000">
              <StatisticsInfo LastUpdate="2023-02-09T03:47:24.27" ModificationCount="7831" SamplingPercent="100" Statistics="[index_nonclustered_1]" Table="Object2" Schema="Schema1" Database="Database1" />
              <Predicate>
                <ScalarOperator ScalarString="ScalarString2">
                  <Compare CompareOp="EQ">
                    <ScalarOperator>
                      <Identifier>
                        <ColumnReference Database="Database1" Schema="Schema1" Table="Object2" Alias="Object4" Column="Column3" />
                      </Identifier>
                    </ScalarOperator>
                    <ScalarOperator>
                      <Identifier>
                        <ColumnReference Column="Column4" />
                      </Identifier>
                    </ScalarOperator>
                  </Compare>
                </ScalarOperator>
              </Predicate>
            </ParameterSensitivePredicate>
          </Dispatcher>

The Dispatcher block has the details for this plan that relate to PSPO.

  • The ParameterSensitivePredicate block shows the boundary values for the parameter, and there are two blocks in this plan. Both plans have boundary values of 100 and 100,000.
  • The StatisticsInfo block is very useful; it shows the statistic being used to make estimates and its sampling rate. The object and database are also indicated
  • The columns that relate to the parameters we are using for PSPO are in the ColumnReference block.

In my case, I saw two plans for the query in question, and if there were any differences they were trivial. Here’s one of the last blocks in the XML plan:

            </RelOp>
            <ParameterList>
              <ColumnReference Column="Column4" ParameterDataType="int" ParameterCompiledValue="Value1" />
              <ColumnReference Column="Column8" ParameterDataType="int" ParameterCompiledValue="Value2" />
              <ColumnReference Column="Column6" ParameterDataType="bit" ParameterCompiledValue="Value3" />
              <ColumnReference Column="Column12" ParameterDataType="int" ParameterCompiledValue="Value4" />
              <ColumnReference Column="Column2" ParameterDataType="int" ParameterCompiledValue="Value5" />
              <ColumnReference Column="Column10" ParameterDataType="bigint" ParameterCompiledValue="Value6" />
            </ParameterList>
          </QueryPlan>

Column2 and Column4 are the two related to our PSPO parameters. But there are several other columns that are important to our plan. The ParameterCompiledValue shows the actual value provided for each column when the plan was created. We see “Value1” because this is an anonymized plan.

Using these values, I was able to see how many records we should expect for each using the histogram from our statistics. While the cardinality of Column2 and Column4 may vary a lot depending on the inputs, other columns would not vary as much. Two, in particular, indicated that we would return 1 or a handful of rows at most.

So while the optimizer does the extra work of generating extra plans based on the parameters that have significant skew, the plan is really being driven by other parameters with much lower cardinality.

IN SUMMARY

I’ll post more on this subject as I come across anything new. I will also be presenting a session on Parameter Sensitive Plan Optimization at PASS Data Community Summit in Seattle this November. I hope you’ll consider attending. Last year was my first as a presenter, and I had a wonderful time.


You can follow me on Twitter (@sqljared) and contact me if you have questions. My other social media links are at the top of the page. Also, let me know if you have any suggestions for a topic for a new blog post.

I wrote about Parameter Sensitive Plan Optimization in my last blog. In this post, I want to talk about a specific problem you may see in Query Store, depending on how to get information from it.

A Query Store Example

I use Query Store frequently, and I tend to be working on a specific stored procedure at a time. Either I’m evaluating a procedure to see how we can improve its performance, or I’m testing\validating the improvements to that procedure. Here’s an example Query Store script I might use.

SELECT 
	qsq.query_id,
	qsp.plan_id,
	CAST(qsp.query_plan as XML) AS query_plan,
	qt.query_sql_text,
	rsi.end_time,
	(rs.avg_duration * rs.count_executions) as total_duration,
	rs.avg_duration,
	rs.count_executions,
	rs.avg_cpu_time,
	rs.avg_logical_io_reads,
	rs.avg_rowcount
FROM sys.query_store_query qsq
INNER JOIN sys.query_store_plan qsp
	ON qsp.query_id = qsq.query_id
INNER JOIN sys.query_store_query_text qt
	ON qt.query_text_id = qsq.query_text_id
INNER JOIN sys.query_store_runtime_stats rs
	ON rs.plan_id = qsp.plan_id
INNER JOIN sys.query_store_runtime_stats_interval rsi
	ON rsi.runtime_stats_interval_id = rs.runtime_stats_interval_id
WHERE
	qsq.object_id = OBJECT_ID('dbo.User_GetByReputation')
	AND rsi.end_time > DATEADD(DAY,-2, GETUTCDATE())

This query gets the execution stats from the procedure I used in my last blog post against the StackOverflow2013 database. Any executions in the last two days will be included in the results.

Or it should. When I run this I get “(0 rows affected)”.

But I just ran this procedure, so what’s the issue?

sys.query_store_query_variant

This is an example of a query that needs to be updated for SQL Server 2022 with Parameter Sensitive Plan Optimization in place, and the reason has to do with changes made to allow variant queries.

There is a new table in Query Store that is essential to the PSPO feature: sys.query_store_query_variant.

The table is something of a stub, with only three columns. This establishes the relationship between the parent query, variant queries, and the dispatcher plan.

You can see in this case there are two variants for the same parent_query_id. So, for a given query you could LEFT JOIN to sys.query_store_query_variant to find any variant queries it may have, then join back to sys.query_store_query to get the rest of the details for that variant query.

Parent Queries Don’t Execute

But why did my query have no results?

The first issue is that the parent queries and the plan associated with them don’t execute. Joining the tables that give the query, plan, and text is fine, but when we INNER JOIN sys.query_store_runtime_stats and sys.query_store_runtime_stats_interval we lose our results.

Running the same query with LEFT JOINs shows the execution stats are all NULL.

While we are here, if I click on the link for the plan I will see the dispatcher plan. This isn’t a full execution plan, but there is some information about the use of PSPO (the boundaries and details of the statistic used) in the XML.

<ShowPlanXML xmlns="http://schemas.microsoft.com/sqlserver/2004/07/showplan" Version="1.564" Build="16.0.1050.5">
  <BatchSequence>
    <Batch>
      <Statements>
        <StmtSimple StatementText="SELECT &#xD;&#xA;		u.AccountId,&#xD;&#xA;		u.DisplayName,&#xD;&#xA;		u.Views,&#xD;&#xA;		u.CreationDate&#xD;&#xA;	FROM dbo.Users u&#xD;&#xA;	WHERE &#xD;&#xA;		u.Reputation=@Reputation" StatementId="1" StatementCompId="3" StatementType="MULTIPLE PLAN" RetrievedFromCache="false" QueryHash="0x08FD84B17223204C" QueryPlanHash="0x86241E8431E63362">
          <Dispatcher>
            <ParameterSensitivePredicate LowBoundary="100" HighBoundary="1e+06">
              <StatisticsInfo LastUpdate="2023-05-19T14:04:14.91" ModificationCount="0" SamplingPercent="100" Statistics="[IX_User_Reputation]" Table="[Users]" Schema="[dbo]" Database="[StackOverflow2013]" />
              <Predicate>
                <ScalarOperator ScalarString="[StackOverflow2013].[dbo].[Users].[Reputation] as [u].[Reputation]=[@Reputation]">
                  <Compare CompareOp="EQ">
                    <ScalarOperator>
                      <Identifier>
                        <ColumnReference Database="[StackOverflow2013]" Schema="[dbo]" Table="[Users]" Alias="[u]" Column="Reputation" />
                      </Identifier>
                    </ScalarOperator>
                    <ScalarOperator>
                      <Identifier>
                        <ColumnReference Column="@Reputation" />
                      </Identifier>
                    </ScalarOperator>
                  </Compare>
                </ScalarOperator>
              </Predicate>
            </ParameterSensitivePredicate>
          </Dispatcher>
        </StmtSimple>
      </Statements>
    </Batch>
  </BatchSequence>
</ShowPlanXML>

But if we didn’t execute the dispatcher plan for the parent query, we should have executed the plan for the variant query. Why didn’t we see that in our results?

Variant Queries’ Object_ID = 0 (Adhoc)

The second issue is that variant queries have an object_id of 0 in sys.query_store_query; the same as an ad-hoc query.

I was filtering on the object_id of my procedure to only get results for that procedure, but that doesn’t include our variant queries.

But I can query from the sys.query_store_query_variant table to sys.query_store_query based on the query_variant_query_id to get the details for my variant query, then join to other tables to get the stats I was looking for.

SELECT 
	var.*,
	qsq.query_id,
	qsp.plan_id,
	CAST(qsp.query_plan as XML) AS query_plan,
	qt.query_sql_text,
	rsi.end_time,
	(rs.avg_duration * rs.count_executions) AS total_duration,
	rs.avg_duration,
	rs.count_executions,
	rs.avg_cpu_time,
	rs.avg_logical_io_reads,
	rs.avg_rowcount
FROM sys.query_store_query_variant var
INNER JOIN sys.query_store_query qsq
	ON qsq.query_id = var.query_variant_query_id
INNER JOIN sys.query_store_plan qsp
	ON qsp.query_id = qsq.query_id
LEFT JOIN sys.query_store_query_text qt
	ON qt.query_text_id = qsq.query_text_id
LEFT JOIN sys.query_store_runtime_stats rs
	ON rs.plan_id = qsp.plan_id
LEFT JOIN sys.query_store_runtime_stats_interval rsi
	ON rsi.runtime_stats_interval_id = rs.runtime_stats_interval_id
	AND rsi.end_time > DATEADD(DAY,-2, GETUTCDATE());

Getting the runtime statistics isn’t the hard part, it’s just identifying which queries we care about.

Silent Failure

If you use Query Store regularly, and especially if you have any tools or automation built on that information, you’ll need to account for the two points above. Because your existing scripts won’t fail, they will give you incomplete results. This is a case where an actual error would be more helpful; you’d know something had broken.

So, how do we get all the execution details for our procedure? First, let’s see the parent query and its children (updated per the addendum).

SELECT 
	qsq.query_id,
	qsp.plan_id,
	qsp.plan_type_desc,
	vr.parent_query_id,
	vr.query_variant_query_id,
	qv.query_id,
	qvp.plan_id,
	qvp.plan_type_desc
FROM sys.query_store_query qsq
INNER JOIN sys.query_store_plan qsp
	ON qsp.query_id = qsq.query_id
LEFT JOIN sys.query_store_query_variant vr
	ON vr.parent_query_id = qsq.query_id
    AND vr.dispatcher_plan_id = qsp.plan_id
LEFT JOIN sys.query_store_query qv
	ON qv.query_id = vr.query_variant_query_id
LEFT JOIN sys.query_store_plan qvp
	ON qvp.query_id = qv.query_id
WHERE
	qsq.object_id = OBJECT_ID('dbo.User_GetByReputation');

Also, note that sys.query_store_plan has two new columns that are relevant to us; plan_type_desc and plan_type. Query_id 48 is the parent query related to the “Dispatcher Plan”; the variant plan is marked as “Query Variant Plan”. A normal plan would be a “Compiled Plan”.

A Suggested Solution

We could return both, but we don’t really need to. The parent query has no related performance statistics, but we need the parent query to find all the variant queries that allow us to get the execution statistics.

There is one more issue to consider; sys.query_store_query_variant does not exist in a SQL Server instance below 2022. So if we want a procedure that can run on our un-upgraded instances, we’ll need two paths.

Oh, we also want to make sure we don’t miss plans for any queries not using PSPO.

Here’s a simple procedure that does that (which has been updated per the addendum).

USE StackOverflow2013 
GO
CREATE OR ALTER PROCEDURE dbo.QS_GetProcedurePerfDetails
  @Schema_Object NVARCHAR(100),
  @StartDate DATETIME2
AS
	DECLARE 
		@c_level INT,
		@obj_id INT;

	CREATE TABLE #QueryList (
		query_id INT,
		plan_id INT,
		query_plan NVARCHAR(MAX),
		query_text_id INT,
		plan_type_desc NVARCHAR(120) NULL
	);

	SELECT 
		@c_level = db.compatibility_level  
	FROM sys.databases db
	WHERE 
		db.database_id = DB_ID();

	SET @obj_id = OBJECT_ID(@Schema_Object);

	-- Based on the compatability level, get IDs for relevant queries and plans
	IF (@c_level < 160)
	BEGIN 
		INSERT #QueryList
		SELECT 
			qsq.query_id,
			qsp.plan_id,
			qsp.query_plan,
			qsq.query_text_id,
			NULL AS plan_type_desc
		FROM sys.query_store_query qsq
		INNER JOIN sys.query_store_plan qsp
			ON qsp.query_id = qsq.query_id
		WHERE
			qsq.object_id = @obj_id;
	END
	ELSE
	BEGIN
		INSERT #QueryList
		SELECT 
			ISNULL(qv.query_id,qsq.query_id) AS query_id,
			ISNULL(qvp.plan_id,qsp.plan_id) AS plan_id,
			ISNULL(qvp.query_plan,qsp.query_plan) AS query_plan,
			ISNULL(qv.query_text_id,qsq.query_text_id) AS query_text_id,
			ISNULL(qvp.plan_type_desc,qsp.plan_type_desc) AS plan_type_desc
		FROM sys.query_store_query qsq
		INNER JOIN sys.query_store_plan qsp
			ON qsp.query_id = qsq.query_id
		LEFT JOIN sys.query_store_query_variant vr
			ON vr.parent_query_id = qsq.query_id
            AND vr.dispatcher_plan_id = qsp.plan_id
		LEFT JOIN sys.query_store_query qv
			ON qv.query_id = vr.query_variant_query_id
		LEFT JOIN sys.query_store_plan qvp
			ON qvp.query_id = qv.query_id
		WHERE
			qsq.object_id = @obj_id;
	END;

	SELECT 
		ql.query_id,
		ql.plan_id,
		ql.plan_type_desc,
		CAST(ql.query_plan as XML),
		qt.query_sql_text,
		rsi.end_time,
		(rs.avg_duration * rs.count_executions) as total_duration,
		rs.avg_duration,
		rs.count_executions,
		rs.avg_cpu_time,
		rs.avg_logical_io_reads,
		rs.avg_rowcount
	FROM #QueryList ql
	INNER JOIN sys.query_store_query_text qt
		ON qt.query_text_id = ql.query_text_id
	LEFT JOIN sys.query_store_runtime_stats rs
		ON rs.plan_id = ql.plan_id
	LEFT JOIN sys.query_store_runtime_stats_interval rsi
		ON rsi.runtime_stats_interval_id = rs.runtime_stats_interval_id
	WHERE
		rsi.end_time > @StartDate
	ORDER BY
		qt.query_sql_text,
		rsi.end_time;
GO

EXEC dbo.QS_GetProcedurePerfDetails
  @Schema_Object = 'dbo.User_GetByReputation',
  @StartDate = '2023-05-24';
GO

I’m checking to see if the compatibility level is at least 160 as a way to see if we are on SQL Server 2022 or not. Of course, we could be using SQL Server 2022 with a lower compatibility level, but the sys.query_store_query_variant table would be empty in that case.

The key is to have an initial step to get the queries and plans we want. This has a LEFT JOIN to sys.query_store_query_variant in case there are variant queries to consider. We join to get the other details for the variant (the query_text_id, plan_id, and the plan itself) if they exist.

I’m throwing those initial results in a temp table to use in the final query. I’ve also found in my testing that splitting this operation in two helps to prevent the plan from getting too large and sluggish.

The temp table is populated with the details of the variant query and its “Query Variant Plan”, if present, but if they are NULL we use the details of what must be a normal query with a “Compiled Plan”.

From here, you can also get more complex and include options to aggregate the Query Store details or include more columns, but this should solidify how to incorporate sys.query_store_query_variant into your scripts.

In Summary

This is something I’ve been working on for a while. It became obvious to me months ago that we needed to include this logic at work so that our own Query Store aggregation wouldn’t suddenly miss a lot of executions.

Hopefully, this post will help some readers to avoid this pitfall.

You can follow me on Twitter (@sqljared) and contact me if you have questions. My other social media links are at the top of the page. Also, let me know if you have any suggestions for a topic for a new blog post.

Addendum

As I pointed out in my next post, the join I originally made to sys.query_store_query_variant was incorrect. If you only join based on the query_id, the result set gets multiplied. Each variant query is shown as related to all plans for the parent query, even “compiled plan” type plans which do not use PSPO at all.

I’ve updated the scripts above in two places, but wanted to call that out.