How Relevant is the TOP operator?

I’ve explained what a blocking operator is and provided a few examples, but maybe this doesn’t seem important. It’s affecting the TOP operator, sure, but don’t people just use this to look at the TOP 1000 rows of their tables in SSMS?

The TOP operator is useful for many operations, especially in a large environment. Large operation can timeout or fail for a variety of reasons, consuming resources without providing the results you need. A small, batch-sized operation is more likely to succeed and tends to perform more consistently. Many maintenance operations make sense to run with a TOP operator, so we should make sure those operations aren’t stymied by blocking operators. Some examples:

  • Garbage collection on a table with many millions rows. You want this to perform quickly, but you really can’t afford for this to time out (whatever that timeout period may be). We can limit how long this runs by GC’ing a small batch at a time, but this can be hampered badly by an extra sort or a hash join.
  • Archiving data applies for the same reasoning as GC. If you archive data to another table\database\server, you’ll want to keep your operation small enough to manage.
  • Backfilling a new column. If the existing table is large, you can’t just UPDATE the whole table; you’ll lock the table and block all your users. A batched UPDATE in a loop or in a scheduled process can resolve this without causing an outage.
  • GDPR is here, and CCPA is coming. You may need to anonymize data across many related tables. We need this to perform well to cleanse our existing data, and we’ll continue running this process going forward.
  • Queries producing potentially large results to your application may need to be batched as well. If this times out, you’re still wasting a lot of time and reads, even if no data is changed.

Out the Window

I examined one process recently that was similar to this query, causing a GC operation to time out.

SELECT TOP 100
	inv.InvoiceID,
	ili.InvoiceLineID,
	ROW_NUMBER() OVER(Partition By inv.CustomerID ORDER BY inv.InvoiceDate) AS SortID
FROM Sales.Invoices inv
JOIN Sales.InvoiceLines ili
	ON ili.InvoiceID = inv.InvoiceID
WHERE
	inv.InvoiceDate < DATEADD(day, -60, GETUTCDATE()) 
	AND ili.LastEditedWhen < DATEADD(day, -60, GETUTCDATE()) 
ORDER BY SortID 

It was a SELECT statement, and it inserted the important fields into a temp table, and ran DELETEs against multiple tables based on the contents of the temp table. But it was the initial SELECT that had a poor plan and caused the timeout.

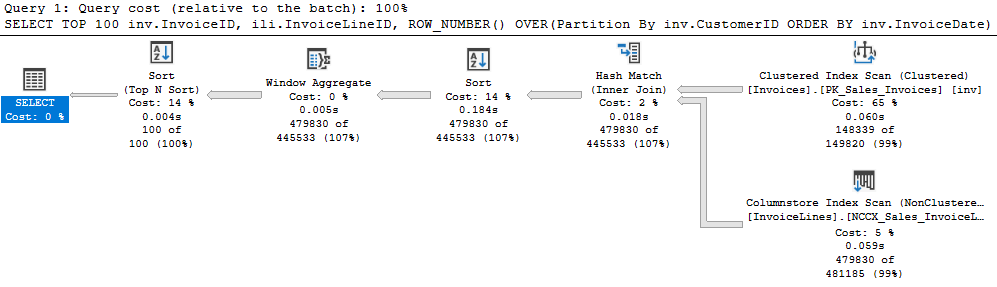
I quickly saw a SORT in the execution plan and wondered why. The actual query didn’t have an ORDER BY clause. But it did have a ROW_NUMBER OVER in the select list; took me a minute to notice that.

But was the sorting necessary? “We need to delete really old records in this table, but it’s vitally important that we delete them in the order they were originally inserted!”

It seemed a poor reason to sort a table with tens of millions of rows. Coupled with the very small batch size, we were doing an extraordinary amount of work to get rid of a few rows. So what if we commented the ROW_NUMBER and the ORDER BY out?

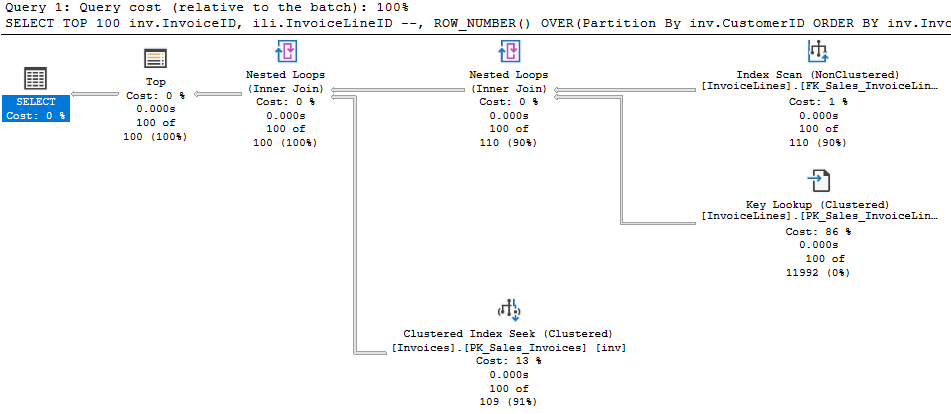
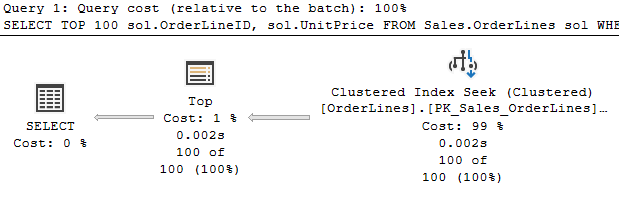
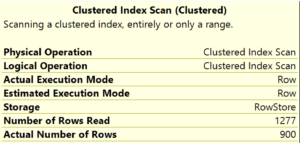
Even though the new plan has a scan operator, we only read 110 rows from it because we are using the TOP operator properly. Note the row counts from the first plan again. We have 479 thousand rows going through multiple operators in the first, but only 100 per operation in the second.

Avoid one Blocking Operator, find another

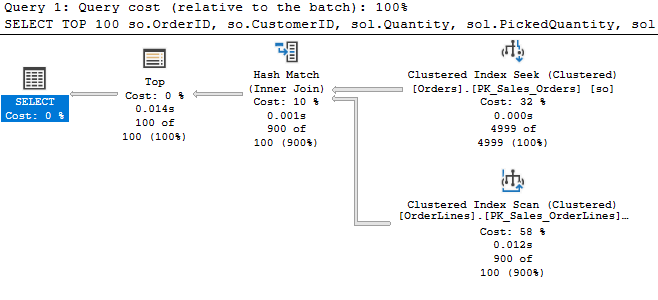
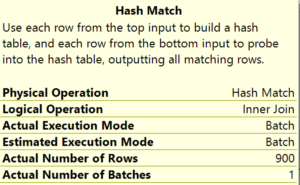
Here’s an example from recent work. I was looking at a query in a GC that was populating a temp table to use for later DELETEs. I was anticipating the optimizer to try a hash match join, so I used an INNER LOOP JOIN hint to avoid that blocking operator. The results were quite unpleasant, as you can see in this anonymized plan.

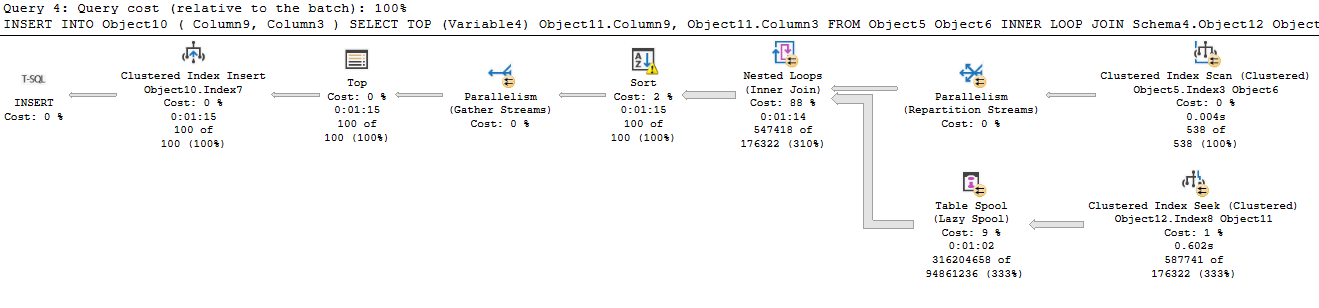
So, I avoided the hash match join, but the SQL Server optimizer didn’t see it the way I did. The first table is a temp table, Object6, which we are joining to a normal table, Object11. But this plan includes a table spool that not only forces us to read all 587741 rows in the seek against our table, it seems to create a cross join in memory between the results of the clustered index scan on the temp table and the clustered index seek against the base table (538 * 587741 = 316204658).

That hint obviously wouldn’t work. I reversed the order of the tables, then removed the hint altogether, giving the following:


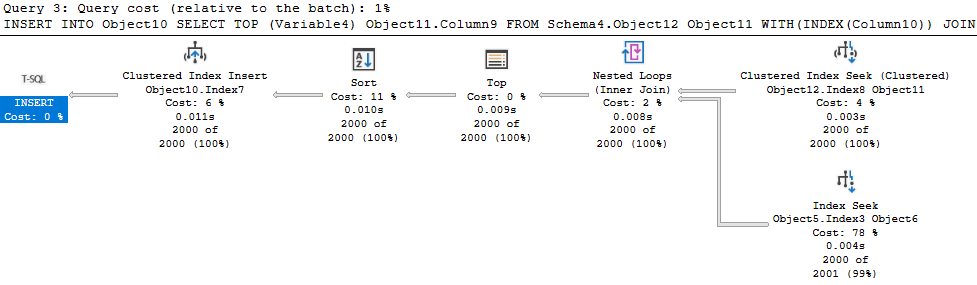
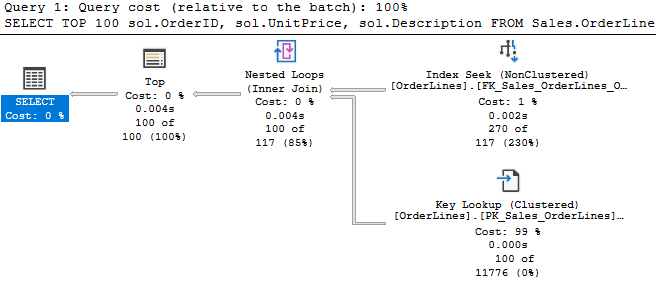
2000 rows returned across the board. There is a SORT operation, but it’s after the TOP so there’s no harm.. Our results are being sorted before inserting them into a second temp table. And a much more performant query, taking ~8 ms instead of 75000 ms.

Sort out blocking operators

Hopefully this has been informative. I honestly wasn’t aware of blocking operators until a month or two ago. That’s the frustrating and interesting thing of SQL Server sometimes; you can work on this as long as I have and, even putting new development aside, there’s always more to learn.

Hope this helps you optimize some of your own operations.

It seems so simple

The TOP operator seems pretty straightforward. “Hey SQL Server, give me the first 100 rows that match this criteria, then stop.” But when certain operations get involved it can go sideways.

Let’s start with a simple example in the WorldWideImporters database.

SELECT TOP 100 
	sol.OrderLineID, 
	sol.UnitPrice 
FROM Sales.OrderLines sol 
WHERE sol.OrderLineID < 1000 
	AND sol.UnitPrice > 50

The query here is simple, and we can see the TOP operator only returns 100 rows, but so does the index seek underneath. The way this works is that the TOP asks the operation connected to it for 1 row, and keeps asking until it has 100 or the operation below can’t find anymore rows that match.

Because of the WHERE clause I chose, we actually had to read 943 rows in the table to get 100 that matched. At that point the TOP stopped asking for more rows.

If the TOP operator kept asking for more rows and only displayed the first 100, that would have been a waste of effort. Still, we’re only querying 1 index here.

Let’s add a wrinkle

SELECT TOP 100 
	sol.OrderID, 
	sol.UnitPrice,
	sol.Description
FROM Sales.OrderLines sol 
WHERE 
	sol.OrderID < 1000 
	AND sol.Quantity > 5
ORDER BY sol.OrderID

Now we have a key lookup, and we can follow the flow of what happened. We read and returned 270 rows from the index seek. There’s a nested loops operator connecting us to our key lookup, and that returned only 100 rows. So, we had to read 270 rows from the index seek to find 100 rows that met all our filters. 

Ultimately the TOP operator was asking for 1 row repeatedly until it met its quota, and then it stopped asking for more. As expected. 

What’s a blocking operator?

So, with another change we’ll see one of those operators I mentioned earlier.

SELECT TOP 100 
	sol.OrderID, 
	sol.UnitPrice,
	sol.Quantity,
	sol.PickedQuantity,
	sol.LastEditedWhen
FROM Sales.OrderLines sol 
WHERE 
	sol.OrderID < 5000 
	AND sol.Quantity > 5
ORDER BY sol.LastEditedWhen

Here, we’re seeking based on a range of OrderIDs, but getting results sorted in a different order. We’re reading many more records from the index and the key lookup (where the estimate is wayyy off). We don’t need to read this much to get our results, because we returned 2160 rows from the key lookup and the nested loops join, but then we reduce when we hit the sort.

It makes sense that you can’t return the top 100 rows that meet this criteria, until you’ve seen them all. Well, unless the data is in the order you want, and you can just seek it that way from the index. Our previous query had an ORDER BY clause but no sort operation because our sort matched our range seek.

Sort is a blocking operator. Don’t feel bad if you haven’t heard of the term; I’ve been working with SQL Server for 15 years, and I’m sure I never heard the term until the incomparable Grant Fritchey mentioned it while he was lecturing at my place of employment.

So sorts and several other types of operators (eager spools, remote query\scan\etc, hash match joins, and more) will block the normal flow and gather all their results before passing any rows on. The hash match join only blocks while building its hash table from the first input, before probing the second.

Let’s hash it out

SELECT TOP 100 
	so.OrderID, 
	so.CustomerID,
	sol.Quantity,
	sol.PickedQuantity,
	sol.LastEditedWhen
FROM Sales.OrderLines sol 
JOIN Sales.Orders so
	ON so.OrderID = sol.OrderID
WHERE 
	sol.OrderID < 5000 
	AND sol.Quantity > 5
--ORDER BY sol.LastEditedWhen

We filtered on OrderID < 5000, and we read 4999 rows from the build table. So we read everything that fit that criteria; we didn’t stop early because we had our 100 rows. So, definitely blocking behavior.

Then we probe the second table and return 900 rows, and they pass through the hash match. The results get reduced to 100 by the TOP operator. 

Why 900 rows from the OrderLines table, not 100? That’s less than clear. As I vary the result set or the TOP size, I get a number of behaviors using different indexes and returning batches of various sizes. It appears the probe may be trying to do a batch of rows at a time, or it may be related to the memory allocated. (If I can get a clearer answer to this aspect, I’ll update the post).

Update: I consulted with my colleague, the superb Kevin Feasel, who suggested this was operating in batch mode. I was testing this using SQL Server 2019, and batch mode on rowstore is a new feature that everyone should be aware of.

I thought I had ruled this out however, and indeed the probe operation was in row mode:

However, the hash match operation was not!

So the hash match requested a batch of 900 rows, which is why we saw the unexpected number of rows.

If you try this in SQL Server 2019, you may see different behaviors as you vary the result set (when I removed LastEditedWhen from the result set, it changed to row mode and only returned 100 rows) or the TOP size (TOP 1000 dropped it back to row mode). I also saw some variation with the index used against OrderLines, including the columnstore index.

Summing up

These have been relatively simple examples of the TOP operator in action, and how it interacts with other operators. In my next post, I’ll provide some more complicated plans, and discuss how we can keep our TOPs in top shape.